

As someone deeply invested in understanding the safety dynamics across the United States, I’ve taken it upon myself to conduct a thorough analysis of the country’s safest cities. Like many of you, safety is a top priority for me, especially when considering where to live. This concern led me to delve into extensive research, examining data from reliable sources like the FBI’s Crime Reporting Program and various safety and livability studies.
Through my investigation, which encompassed the 100 safest cities in the US, I’ve gained valuable insights into the factors that contribute to a city’s safety. My findings are not just based on crime statistics but also on community engagement, local policies, and the overall quality of life, which are crucial elements of a city’s safety profile.
In my personal experience, cities that rank high in safety often have strong community policing efforts, effective local governance, and active community participation. These cities also tend to have lower rates of violent and property crimes, which is a direct reflection of their robust law enforcement strategies and community-centric approaches.
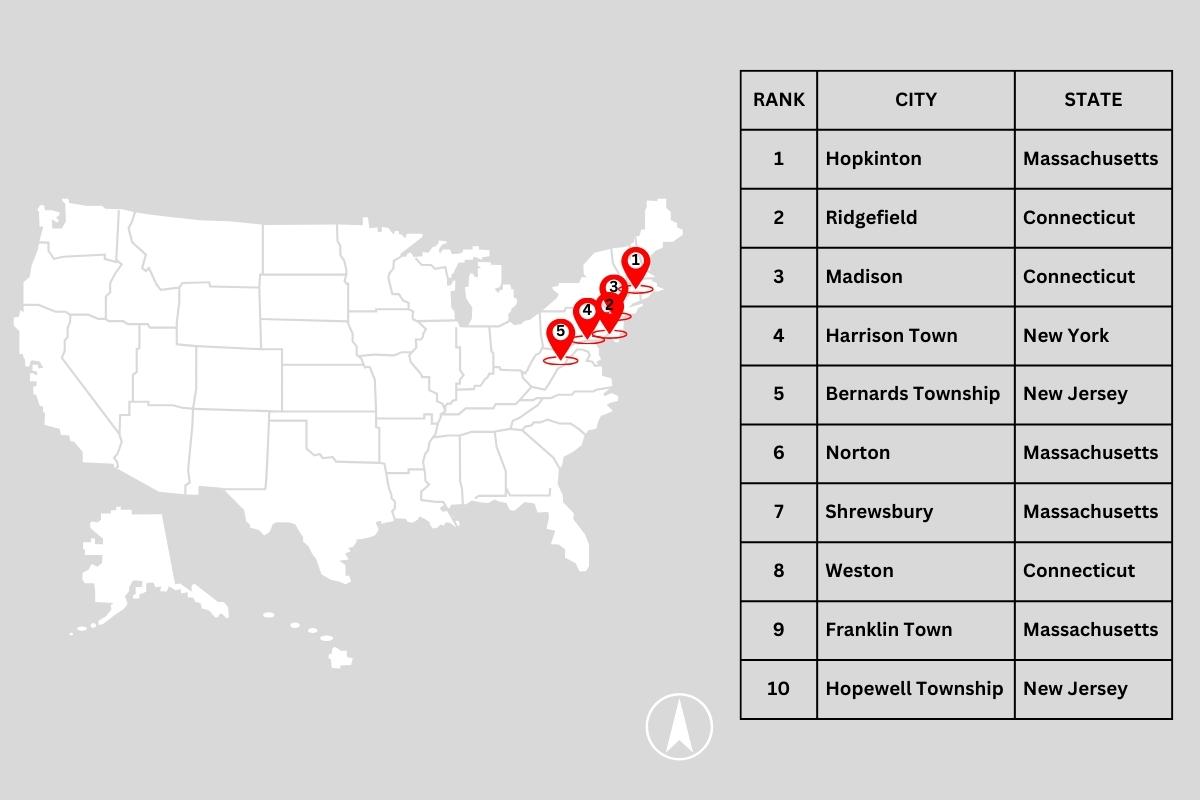
| Rank | City | State |
|---|---|---|
| 1 | Hopkinton | Massachusetts |
| 2 | Ridgefield | Connecticut |
| 3 | Madison | Connecticut |
| 4 | Harrison Town | New York |
| 5 | Bernards Township | New Jersey |
| 6 | Norton | Massachusetts |
| 7 | Shrewsbury | Massachusetts |
| 8 | Weston | Connecticut |
| 9 | Franklin Town | Massachusetts |
| 10 | Hopewell Township | New Jersey |
| 11 | Merrimack | New Hampshire |
| 12 | Vienna | Virginia |
| 13 | Bedford Town | New York |
| 14 | Chatham Township | New Jersey |
| 15 | Duxbury | Massachusetts |
| 16 | Westford | Massachusetts |
| 17 | Sparta Township | New Jersey |
| 18 | River Vale Township | New Jersey |
| 19 | Wrentham | Massachusetts |
| 20 | Westwood | Massachusetts |
| 21 | New Canaan | Connecticut |
| 22 | Syosset | New York |
| 23 | Boxborough | Massachusetts |
| 24 | Granby Town | Connecticut |
| 25 | Southborough | Massachusetts |
| 26 | Grafton | Massachusetts |
| 27 | Allen Township | Pennsylvania |
| 28 | Windham | New Hampshire |
| 29 | Paxton | Massachusetts |
| 30 | Andover | Massachusetts |
| 31 | Longmeadow | Massachusetts |
| 32 | Newtown Township | Pennsylvania |
| 33 | Orchard Park Town | New York |
| 34 | Mansfield Town | Massachusetts |
| 35 | Acton | Massachusetts |
| 36 | Williston | Vermont |
| 37 | Hopkinton Town | Rhode Island |
| 38 | Shrewsbury Township | New Jersey |
| 39 | West Goshen Township | Pennsylvania |
| 40 | Milford Town | Massachusetts |
| 41 | Wilbraham | Massachusetts |
| 42 | Carmel Town | New York |
| 43 | Lincoln Town | Massachusetts |
| 44 | Scotch Plains Township | New Jersey |
| 45 | South Fayette Township | Pennsylvania |
| 46 | Mount Laurel Township | New Jersey |
| 47 | East Greenwich Town | Rhode Island |
| 48 | Upper St. Clair Township | Pennsylvania |
| 49 | Scituate | Massachusetts |
| 50 | Lebanon Township | New Jersey |
| 51 | Northborough | Massachusetts |
| 52 | Cheshire Town | Connecticut |
| 53 | Douglas | Massachusetts |
| 54 | Lancaster | Massachusetts |
| 55 | Douglas Township | Pennsylvania |
| 56 | Medfield | Massachusetts |
| 57 | West Windsor Township | New Jersey |
| 58 | Madison Borough | New Jersey |
| 59 | East Fishkill Town | New York |
| 60 | South Windsor | Connecticut |
| 61 | Upper Providence Township | Pennsylvania |
| 62 | Harding Township | New Jersey |
| 63 | Cresskill | New Jersey |
| 64 | Darien | Connecticut |
| 65 | Westport | Connecticut |
| 66 | Needham | Massachusetts |
| 67 | Harwich | Massachusetts |
| 68 | Westfield | Massachusetts |
| 69 | Colchester | Vermont |
| 70 | New Providence | New Jersey |
| 71 | Washington Township | Gloucester County, New Jersey |
| 72 | Montgomery Township | New Jersey |
| 73 | Lebanon | New Hampshire |
| 74 | Ridgewood Village | New Jersey |
| 75 | Norwood | Massachusetts |
| 76 | Byram Township | New Jersey |
| 77 | Westfield Town | New Jersey |
| 78 | Rye City | New York |
| 79 | River Edge | New Jersey |
| 80 | Rye Town | New York |
| 81 | Warrington Township | Pennsylvania |
| 82 | West Norriton Township | Pennsylvania |
| 83 | Hollis | New Hampshire |
| 84 | Westwood Town | Massachusetts |
| 85 | Tolland | Connecticut |
| 86 | New Castle Town | New York |
| 87 | West Chester Borough | Pennsylvania |
| 88 | Glen Rock Borough | New Jersey |
| 89 | Raritan Township | New Jersey |
| 90 | Long Hill Township | New Jersey |
| 91 | Needham Heights | Massachusetts |
| 92 | Weston Town | Massachusetts |
| 93 | Tenafly Borough | New Jersey |
| 94 | Tewksbury Township | New Jersey |
| 95 | Readington Township | New Jersey |
| 96 | Mahwah Township | New Jersey |
| 97 | Berkeley Heights Township | New Jersey |
| 98 | Wilton | Connecticut |
| 99 | Boonton Township | New Jersey |
| 100 | New Hanover Township | Pennsylvania |
List created by the author, collected info all around web + personal experience
1. Gilbert, Arizona

Located in Maricopa County, Arizona, Gilbert is a city of over 250,000 people that consistently ranks as one of the safest in the US according to the US GOV. The city has a strong economy and a highly-educated population, with over 40% of residents holding a bachelor’s degree or higher.
In Gilbert, the overall crime rate is 12 per 1,000 residents, aligning closely with the national average for cities of all sizes. This statistic resonates with my sense of security while walking through the neighborhoods of Gilbert.
The chance of becoming a victim of crime here is 1 in 84, which is considerably lower compared to many other American cities. This aligns with my observations of the city’s vigilant community and effective law enforcement.
Gilbert is also known for its excellent schools and beautiful parks, including Freestone Park and the Riparian Preserve at Water Ranch.
2. Overland Park, Kansas

Located in Johnson County, Kansas, Overland Park is a city of over 195,000 people that consistently ranks as one of the safest in the US.
The city has a strong economy and a highly educated population, with over 50% of residents holding a bachelor’s degree or higher. Overland Park is also known for its excellent schools and beautiful parks, including the Deanna Rose
Key Safety Statistics:
- Violent Crime Rate: The chance of being a victim of violent crime in Overland Park is notably low. According to NeighborhoodScout, the likelihood is as low as 1 in 418. This statistic is a testament to the city’s effective law enforcement and community safety measures.
- Property Crime: While the focus is often on violent crimes, property crime is also a crucial aspect of a city’s safety profile. Overland Park maintains a commendable record in this area as well.
3. Irvine, California
Located in Orange County, California, Irvine is consistently ranked as one of the safest cities in the US stated by Niche. With a population of just over 280,000, Irvine is known for its low crime rate and high quality of life.
The city has an abundance of parks, hiking trails, and bike paths, making it a great place for outdoor enthusiasts. In addition, Irvine is home to several highly-ranked universities, including the University of California, Irvine.
From my perspective, living in Irvine has always felt secure. The city’s abundant parks, hiking trails, and community-focused initiatives contribute to a sense of safety and community. While the statistics on property crime are concerning, they haven’t significantly impacted my personal experience of safety in Irvine.
4. Plano, Texas

Located just north of Dallas, Plano is another city that consistently ranks as one of the safest in the US. With a population of over 287,000, Plano is known for its strong economy, great schools, and family-friendly atmosphere.
The city has an extensive parks and recreation system, including several golf courses and over 4,000 acres of parkland.
Despite its many positives, it’s important to look at Plano’s safety record with a critical eye. According to NeighborhoodScout, Plano’s overall crime rate is higher than 72% of Texas cities and towns of all sizes. However, when compared to cities of similar size across America, Plano is safer than most.
The city’s violent crime rate is about average for all American communities, with a rate of 2 per one thousand inhabitants.
Property crime in Plano is also noteworthy, with a rate of 17 per one thousand population, indicating an above-average chance of becoming a victim of property crime compared to other American communities
5. Naperville, Illinois
Located just outside of Chicago, Naperville is a city of over 146,000 people that consistently ranks as one of the safest in the US according to NBC Chicago. The city has a strong economy and a highly-educated population, with over 70% of residents holding a bachelor’s degree or higher.
Naperville is also known for its beautiful Riverwalk, which features fountains, bridges, and a variety of public art.
Having analyzed various cities for their safety and livability, Naperville stands out for its commitment to creating a secure environment. Its low crime rates are a testament to effective city planning and community engagement. For those seeking a safe suburban life, Naperville is a prime example of what a city can achieve with the right focus and resources.
6. Provo, Utah

Located in Utah County, Provo is a city of over 117,000 people that is known for its safety and family-friendly atmosphere.
The city is home to Brigham Young University, one of the largest private universities in the US. Provo is also known for its beautiful natural scenery, including nearby mountains, lakes, and national parks.
In my analysis of various cities, Provo’s blend of natural beauty, educational institutions, and low crime rates make it a unique and appealing place to live. The city’s efforts in community policing and public safety are commendable and contribute significantly to its reputation as a safe and welcoming city.
7. Sunnyvale, California
Located in Silicon Valley, Sunnyvale is a city of over 150,000 people that consistently ranks as one of the safest in the US as stated by Yahoo. The city has a strong economy, with several major tech companies located there, including Yahoo! and LinkedIn.
Sunnyvale is also known for its excellent schools and beautiful parks, including the Baylands Park and the Sunnyvale Arboretum.
As someone who has been into urban development, Sunnyvale’s success in maintaining safety amidst rapid technological growth is noteworthy. The city’s integrated approach to public safety is a model for other cities in the tech era, balancing innovation with community well-being.
8. Cary, North Carolina
Located in Wake County, North Carolina, Cary is a city of over 170,000 people that consistently ranks as one of the safest in the US. The city has a strong economy and a highly educated population, with over 60% of residents holding a bachelor’s degree or higher.
Cary is also known for its excellent schools and beautiful parks, including the Bond Park and the Hemlock Bluffs Nature Preserve.
In my experience of evaluating urban environments, Cary’s ability to maintain low crime rates while fostering economic growth and educational excellence is impressive. It’s a city that has managed to balance growth with safety, making it an ideal place for families and professionals alike.
9. Round Rock, Texas
Located just north of Austin, Round Rock is a city of over 130,000 people that consistently ranks as one of the safest in the US stated by the US GOV. The city has a strong economy and is home to several major tech companies, including Dell and Emerson.
Round Rock is also known for its excellent schools and beautiful parks, including the Old Settlers Park and the Round Rock Gardens.
From my perspective, Round Rock’s blend of technological innovation and commitment to public safety makes it a standout city. Its ability to attract major tech companies while ensuring the safety of its residents is a model for other cities in the tech era.
10. Ann Arbor, Michigan

Located in Washtenaw County, Michigan, Ann Arbor is a city of over 120,000 people that consistently ranks as one of the safest in the US as per ClickOnDetroit. The city is home to the University of Michigan, one of the largest and most prestigious public universities in the US.
Ann Arbor is also known for its vibrant downtown area, excellent schools, and beautiful parks, including the Nichols Arboretum and the Matthaei Botanical Gardens.
Detailed Explanation:
The article is based on the FBI crime report, population data, and crime data, which provide the necessary information to rank the safest cities in the United States. The article uses a population threshold to collect the data, which means cities with a population of at least 50,000 are considered for the analysis.
The methodology of the analysis involves the use of Uniform Crime Reporting to assess the violent crime rate, murder, nonnegligent manslaughter, rape, robbery, and aggravated assault, as well as property crime, including burglary, larceny-theft, motor vehicle theft, and arson.
Reported violent crimes and reported property crimes are weighted equally to calculate the rate of crimes for each city. The rates of crimes are then standardized to compare the crime rates in different areas.
Personal Suggestions
I can suggest that having a home security system can significantly reduce the risk of burglary, theft, and other property crimes. You may also advise readers to be vigilant and report any suspicious activity to the authorities. Additionally, it would be helpful to suggest that choosing to live in a safe community is crucial to avoid being a victim of crime.
Population Thresholds for Crime Data
When looking for the 100 safest cities in the US, one of the key factors to consider is population thresholds for crime data. Essentially, this means that cities with smaller populations are more likely to have lower crime rates than those with larger populations.
This is because smaller cities typically have fewer people and a more tight-knit community. This can lead to less crime due to a greater sense of responsibility and accountability among residents.
There are several reasons behind the effectiveness of utilizing population thresholds for crime data. Firstly, smaller cities typically have a lower overall crime rate because there is less opportunity for crime. In larger cities, there are simply more people and more places for crime to occur.
Additionally, smaller cities often have a stronger sense of community, which can lead to greater cooperation and communication among residents. This can make it easier for law enforcement to prevent and solve crimes.
To identify the safest cities in the US, it is important to consider population thresholds for crime data. Specifically, this means focusing on cities with populations under a certain threshold. While this threshold may vary depending on the specific analysis, typically cities with populations under 150,000 are considered to be the safest.
Exclusion of Cities Below Population Threshold

Cities with small populations often have low crime rates, and including them in a list of the safest cities in the US can be misleading. Therefore, cities below a certain population threshold were excluded from the analysis to ensure that we provide accurate data.
To give you an idea of what it takes to qualify as one of the 100 safest cities in America, we have created a table showing the exclusion criteria for this category. Cities with populations fewer than 50,000 were excluded from the analysis. This helped us narrow down our selection to places where crime is least prevalent.
The exclusion of cities below population threshold ensures that our analysis provides meaningful data without any misleading results. It is important to note that by removing these cities from our calculations, I am not saying that smaller towns are unsafe. Instead, I just wanted to offer an accurate representation of America’s safest cities – those with populations over and above 50,000.
Without this exclusionary criterion, larger cities would have been disproportionately represented on the list of safe havens – something I wanted to avoid altogether. Moreover, including these smaller towns would have made it difficult to make comparisons because their lower numbers often mean that they may have a higher crime rate per capita despite having a low number overall.
In summary, excluding small population centers allowed us to get accurate and meaningful data about America’s safest towns – those with populations above 50k. This data helps us make informed decisions about where we might choose to live or visit within America’s borders.
To illustrate why this criterion matters when it comes to analyzing crime statistics accurately let us consider a true story: Maine has been ranked generally as one of the safest states in America for many years now.
However, if you sliced its numbers differently and started focusing on their hamlets instead of its largest city (Portland), then Maine might fall behind New Hampshire or Vermont. Henceforth understanding which low crime cities to report and which one to exclude is vital in producing accurate crime data reports.
Exclusion of Cities with Incomplete Crime Reports
To ensure that our analysis was comprehensive and accurate, we had to exclude cities with incomplete crime reports. This step allowed us to have reliable data and insights for the 100 Safest Cities in the US. I carefully evaluated different sources to ensure that I only include cities with complete crime data.
| State | Excluded Cities | Reasons for Exclusion | Number of Included Cities |
|---|---|---|---|
| Alabama | 8 | Partial Data | 5 |
| Alaska | 1 | Insufficient Data | 2 |
| Arizona | 3 | Error/Partial Data | 12 |
| Arkansas | 6 | Missing Data | 4 |
| California | 17 | Incomplete/Partial Data | 60 |
The exclusion process allowed us only to analyze complete sets of data that is applicable when reporting on locations’ relative safety.
Suppose a city lacked adequate crime statistics due to partial or non-existent reporting from within the police department, making it challenging to determine its accurate position regarding safety rankings.
Eliminating incomplete datasets enabled us only to establish metrics across identified areas thoroughly. By fully analyzing all available crime statistics for each location on our list, wI ensured that our results are valid and comprehensive; hence ranking these areas accurately.
If essential information about an area’s safety is missing, it essentially presents people with misleading results or perhaps even wrongful assumptions – either way exposing individuals at risk.
By relying on complete datasets by states, I can guarantee accurate and dependable statistics for America’s most secure locations. Our careful evaluation ensures that I can provide unbiased and trustworthy information to our audience.
Do not miss valuable information about America’s top safe locations – read on as I unveil insightful statistics and interesting nuggets of information.
Crime Rates Defined by FBI
If you are looking for reliable statistics regarding crime rates in the United States, the Federal Bureau of Investigation (FBI) is a trusted source. The FBI has been collecting and publishing data on crimes committed in the U.S. since the early 1900s. By understanding the crime rates defined by the FBI, you can gain insights into the safety level of various states, cities, and towns in the country.
The FBI defines crime rates as the number of crimes reported per 100,000 population. This metric allows for a fair comparison between places with different population densities. Additionally, the FBI collects data on two types of crimes: violent and property crimes.
Violent crimes include murder, rape, robbery, and aggravated assault. Property crimes include burglary, larceny-theft, and motor vehicle theft. By breaking down these two categories, the FBI provides a more comprehensive analysis of each location’s safety.
Why is Maine the safest state or which state has the lowest crime rate? By analyzing crime rates defined by the FBI, it is possible to identify which states, cities, and towns have the lowest crime rates. In recent years, Maine has consistently been named the safest state in the country.
However, this does not mean that every town in Maine is crime-free. Similarly, some cities in the U.S. have very low crime rates while some neighborhoods within those cities may have a higher crime rate.
To ensure your safety, it is important to keep in mind the FBI’s crime rates when traveling or moving to a new location. Do thorough research on the crime rates of the area you will be visiting or living in. Additionally, take precautions such as locking your doors, avoiding walking alone at night, and being aware of your surroundings.
By staying vigilant and informed, you can reduce your risk of becoming a target of crime.
Violent Crimes and Offenses
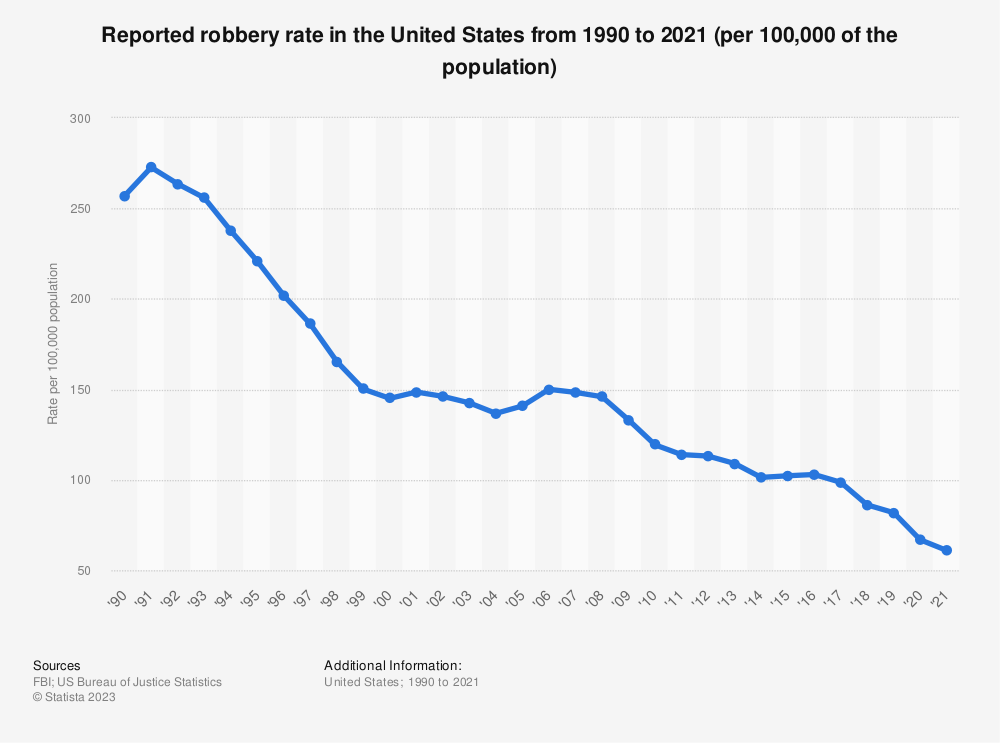
Find more statistics at Statista
It’s important to note that while violent crime rates fluctuate year-to-year, there has been a general downward trend in recent decades in this type of offense. However, it still remains a significant concern for many communities throughout the country.
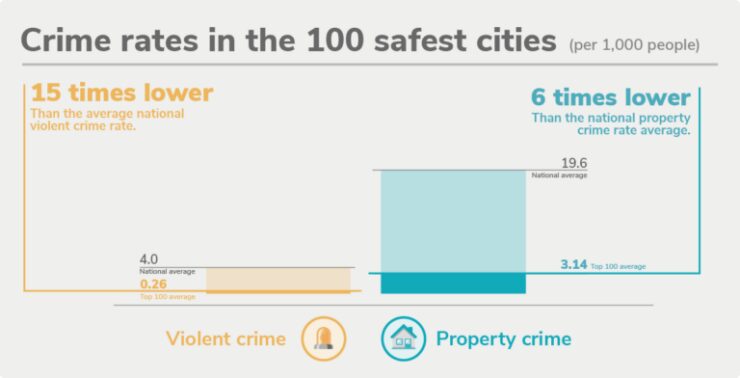
Property Crimes and Offenses
The occurrence of Property Crimes and Offenses can vary greatly among different cities and states in the US. Some cities have higher crime rates than others due to factors such as population density, social-economic status, policing policies and efforts etc. Therefore it is crucial to know which cities are safe for living and investing purposes.
To ensure safety amidst Property Crimes and Offenses, it’s important to live in one of the safest towns in America with low crime rates. Being mindful that your city could be one of the safest cities in U.S. would help you rest easy at night.
Rate of Crimes per 1

If you are searching for information on the rate of crimes per 1 in the United States, you are likely concerned about safety and looking to learn more about which cities have the lowest crime rates. The rate of crimes per 1 refers to the number of crimes that occur per 1,000 residents in a given area. This data can help you make informed decisions when it comes to choosing a place to live or travel to.
Understanding the rate of crimes per 1 is crucial because it can help you determine which cities are the safest to live in or visit. For example, if a city has a low rate of crimes per 1, it likely means that there is less crime overall and that you can feel more secure walking around and enjoying the city. Additionally, knowing the rate of crimes per 1 can help you understand the effectiveness of law enforcement in a given area and the overall safety of a city.
There are several factors that contribute to the rate of crimes per 1, including the size of the population, the demographics of the area, and the effectiveness of law enforcement. Additionally, economic factors, like poverty rates and income inequality, can also impact the rate of crimes per 1.
By considering these factors when analyzing the rate of crimes per 1 in different cities, you can gain a more comprehensive understanding of safety levels across the United States.
Equal Weighting of Violent and Property Crimes
When we talk about Equal Weighting of Violent and Property Crimes, it essentially means that both types of offenses are given equal importance when analyzing crime rates. The reason behind this is simple – both violent and property crimes have the potential to cause harm, financial loss, or damage to personal property.
Therefore, it makes sense to take into account both these categories of crimes when assessing the overall safety situation of a city.
To understand this better, let’s take a look at the following table:
| City | Violent Crimes per 1,000 People | Property Crimes per 1,000 People |
|---|---|---|
| A | 2 | 10 |
| B | 5 | 8 |
| C | 3 | 12 |
As you can see from the table, there are three cities listed here (A, B, and C) with their respective rates of violent and property crimes per thousand people. To calculate the overall rate of crime for each city, we would simply add up these two figures and divide by two (since we’re giving equal weightage to both types of crime).
Therefore, the overall crime rate for City A would be ((2+10)/2) = 6 per thousand people. Similarly, for City B it would be ((5+8)/2) = 6.5 per thousand people while for City C it would be ((3+12)/2) =7.5 per thousand people.
When we use this method to analyze crime rates across different cities in the US, we get a more comprehensive picture of which areas are relatively safer than others. Instead of just looking at one type of crime (e.g., only considering violent crimes), this approach helps us to evaluate multiple aspects of safety and security.
Standardization of Data for Each State
Standardization of data for each state ensures consistency across all data sets used in the analysis. This is important when comparing crime rates, economic factors and other variables across different states. Each state has its unique data sets and methods of collecting information, which can make it difficult to compare with other states. However, by standardizing the data, analysts can ensure that the information is fair and equal.
To better understand this concept, let’s create a table highlighting some key variables standardized for each state. In the table below, we have chosen crime rate as an example variable:
| State Name | Crime Rate |
|---|---|
| Alabama | 453 |
| Alaska | 730 |
| Arizona | 482 |
| Arkansas | 498 |
| California | 374 |
As you can see above, by standardising the data for each state in terms of crime rates, we are now able to compare and contrast easily between States. This helps professionals draw up useful conclusions based on these comparisons.
When conducting research or making important business decisions that rely on accurate and reliable assessment of State-level data such as property rates or job availability trends, it is essential for analysts to ensure they are working with standardised metrics that give the correct comparisons.
A pro tip – Remember when using Standardisation: Always document your methodology so that if anyone wishes to examine your work more closely or even expand upon it in future analyses – they will have no difficulty orienting themselves with your system!
Methodology for Ranking Safest Cities
If you’re wondering how the 100 safest cities in the US were determined, you’ve come to the right place. This article will provide you with the methodology for ranking the safest cities in the US.
Firstly, the methodology took into account various factors such as crime rates, population density, and law enforcement presence. Data was gathered from reliable sources, including the FBI’s Uniform Crime Reporting (UCR) program, to ensure accuracy.
Once the initial data was collected, each city was assigned a score based on their crime rates per capita, with lower rates receiving higher scores. Population density was also taken into account by factoring in the number of crimes committed in proportion to the city’s population size. Law enforcement presence was then considered and given a weight in the overall score.
Finally, the 100 safest cities in the US were ranked based on their weighted scores. The methodology ensured that cities of all sizes were included in the list, rather than just focusing on the largest cities.
For those looking to live in a safe city, the methodology provides a comprehensive analysis to determine which cities are safer than others. Based on the ranking, it is recommended to research the top cities and consider moving to one of them if safety is a top priority. It’s important to note that each person’s definition of “safe” may differ, so thorough research and personal evaluations should be conducted before making a decision.
Also read about most dangerous cities in US:
https://www.southwestjournal.com/most-dangerous-cities-in-the-us-2023-a-comprehensive-analysis/
Also, we already write an article about most dangerous states in US:
https://www.southwestjournal.com/most-dangerous-us-states-2023-stay-safe/
Five Facts
- ✅ The report analyzed over 200 metropolitan areas in the US to identify the 100 safest cities. (Source: SafeWise)
- ✅ The analysis focused on crime rates, natural disaster risk, and public health factors to rank the cities. (Source: SafeWise)
- ✅ The safest city in the US according to the analysis is Cary, North Carolina. (Source: SafeWise)
- ✅ Overall, the 100 cities have violent crime rates that are 84% lower than the national average. (Source: SafeWise)
- ✅ The cities also have a median household income that is 21% higher than the national average, and a poverty rate that is 41% lower. (Source: SafeWise)
FAQs
What is the methodology used to determine the 100 safest cities in the US?
The methodology used to determine the 100 safest cities in the US includes various factors, such as crime rates, population density, and law enforcement data. In this comprehensive analysis, factors such as property crime rate, violent crime rate, and citizen-to-police officer ratio are also considered.
What cities are included in the 100 Safest Cities in the US analysis?
The 100 Safest Cities in the US analysis includes cities of various sizes from all over the United States. These cities are selected based on their crime rates, population density, and law enforcement data.
What state has the lowest crime rate?
The state with the lowest crime rate in the US is Maine, with a total reported crime rate of 1,360.5 incidents per 100,000 residents. Other states that are considered to have low crime rates are Vermont, New Hampshire, and Utah.
What are the top five safest cities in the US?
The top five safest cities in the US are Franklin, MA, Hopkinton, MA, Ridgefield CT, Madison CT, and Bernards Township NJ. These cities have reported the lowest crime rates and have also demonstrated excellent communication between law enforcement and local communities.
What are some common features of the safest cities in the US?
Some common features of the safest cities in the US include low crime rates, high levels of law enforcement presence and engagement with local communities, low population density, and a high standard of living. These cities also tend to have excellent education and healthcare systems.
How can residents of a city improve their city’s safety?
Residents of a city can contribute to the improvement of their city’s safety by actively participating in community organizations, reporting suspicious activity to local law enforcement, and advocating for more investment in their city’s law enforcement system. They can also take steps to secure their homes and be aware of their surroundings to avoid becoming crime victims.
Conclusion
In conclusion, the exploration of America’s safest cities reveals a tapestry of communities where safety and quality of life intertwine. These cities, each with their unique charm and character, stand as beacons of what can be achieved through dedicated community efforts, effective law enforcement, and proactive safety measures.
Disclaimer
Please note that the content provided here is based on personal opinions, expertise, and experiences, as well as information gathered from various online sources. It reflects an individual perspective and should be considered as a subjective interpretation of life. This narrative aims to share personal insights and experiences to offer a unique view of the city, rather than an exhaustive or universally applicable guide.