

The Gini coefficient, a measure of income distribution, is a powerful tool for understanding the economic disparities within countries. A higher Gini coefficient indicates a larger gap between the incomes of the richest and poorest citizens.
Overview
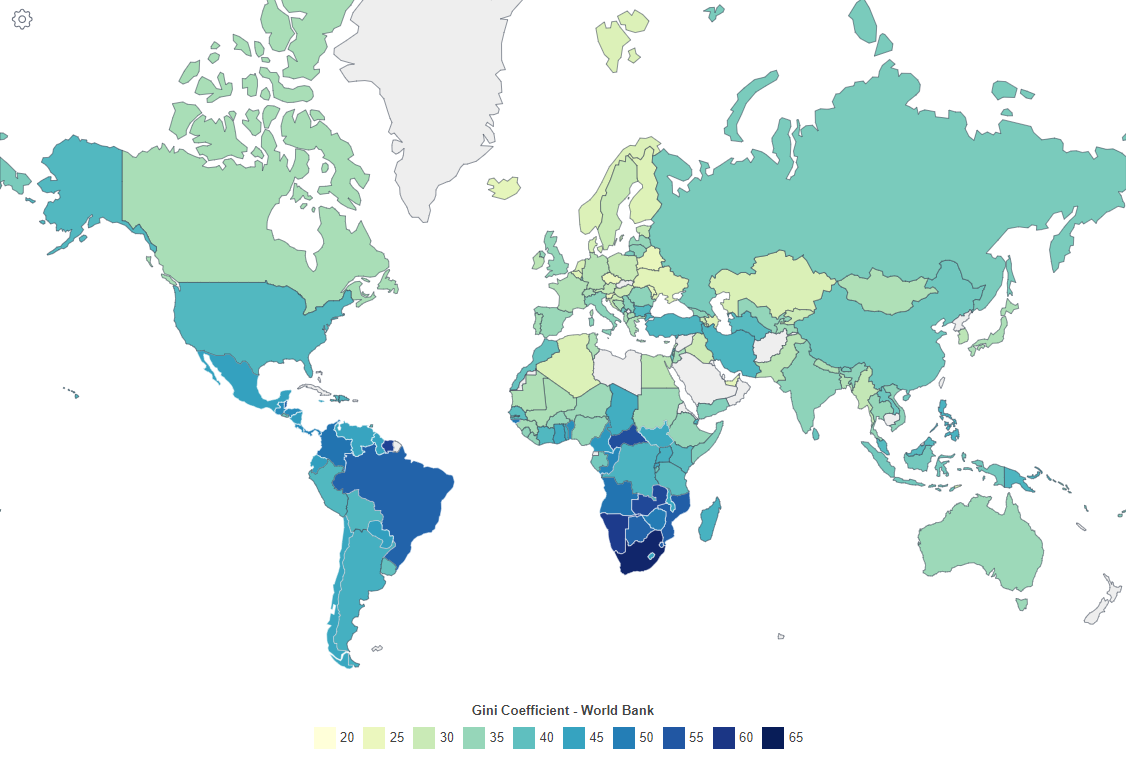
The Gini coefficient, also known as the Gini index or Gini ratio, is the most widely recognized measure of income distribution according to Corporate Finance Institution. In essence, a higher Gini coefficient suggests a more significant disparity between the incomes of a country’s wealthiest and poorest citizens.
- Understanding the Gini Coefficient: Developed by Italian statistician Corrado Gini in 1912, the Gini coefficient varies between 0 and 1, though it’s often expressed as a percentage. For instance, a nation with absolute income equality would have a Gini score of 0 (0%), while a country where one individual earns all the income, leaving the rest with nothing, would have a Gini coefficient of 1 (100%).
- Significance of the Gini Coefficient: The importance of a country’s Gini coefficient cannot be understated. It aids in identifying high levels of income inequality, which can lead to various undesirable political and economic consequences, such as slowed GDP growth, reduced income mobility, increased household debt, political polarization, and heightened poverty rates.
Limitations of the Gini Coefficient
As I read on report by UNCTAD While the Gini coefficient is invaluable for analyzing wealth or income distribution within a country, it has its limitations.
- Not a Measure of Overall Wealth: The Gini coefficient does not reflect a country’s overall wealth or income. For instance, some of the world’s most impoverished nations, like the Central African Republic, have some of the highest Gini coefficients (61.3 in this case). Thus, both a high-income and a low-income country can have identical Gini coefficients.
- Data Reliability Issues: Due to constraints like reliable GDP and income data, the Gini index might sometimes exaggerate income inequality, leading to inaccuracies.
Countries with the Highest and Lowest Gini Coefficients
Income inequality varies significantly across countries, with some nations exhibiting extreme disparities, while others maintain a more equitable distribution.
Highest Gini Coefficients
| Country | Year | Gini Coefficient (%) |
|---|---|---|
| South Africa | 2014 | 63.0 |
| Namibia | 2015 | 59.1 |
| Suriname | 1999 | 57.9 |
| Zambia | 2015 | 57.1 |
| Sao Tome and Principe | 2017 | 56.3 |
| Central African Republic | 2008 | 56.2 |
| Eswatini | 2016 | 54.6 |
| Mozambique | 2014 | 54.0 |
| Brazil | 2019 | 53.4 |
| Belize | 1999 | 53.3 |
South Africa stands out as the country with the most significant income inequality, boasting a Gini coefficient of 63.0 as of 2014. In South Africa, the wealthiest 10% possess 71% of the wealth, whereas the poorest 60% hold a mere 7%. Moreover, over half of South Africa’s population lives in poverty. Other countries with high Gini coefficients include Namibia, Suriname, Zambia, and Sao Tome and Principe.
1. South Africa: The Apex of Inequality

Gini Coefficient (2014): 63.0%
South Africa’s history of apartheid has left an indelible mark on its economic landscape. Despite being one of Africa’s largest economies, the nation grapples with extreme income disparities. The legacy of racial segregation, coupled with current socio-economic challenges, has resulted in a Gini coefficient of 63.0%.
- Key Challenges: According to Trading Economics High unemployment rates, especially among the youth, and a lack of access to quality education and healthcare are significant contributors to the country’s income inequality.
- Bright Spots: The government’s commitment to social grants and welfare programs offers a glimmer of hope in addressing these disparities.
2. Namibia: Shadows of Colonialism

Gini Coefficient (2015): 59.1%
Namibia’s high Gini coefficient can be traced back to its colonial past, where land and resources were concentrated in the hands of a few. Post-independence, the nation has struggled to redistribute wealth equitably.
- Key Challenges: Land ownership remains a contentious issue, with vast tracts still owned by a minority.
- Bright Spots: Efforts are underway to implement land reforms and promote indigenous entrepreneurship to bridge the income gap.
3. Suriname: A Tale of Resource Wealth

Gini Coefficient (1999): 57.9%
Suriname, rich in natural resources like gold and oil, faces the paradox of wealth concentration says the report of the World Bank. The nation’s resource-driven economy has led to income disparities, with benefits accruing to a select few.
- Key Challenges: Dependence on volatile commodity prices and lack of diversification exacerbate economic disparities.
- Bright Spots: Investments in education and infrastructure are seen as potential equalizers for the future.
4. Zambia: Mining Wealth and Disparities
Gini Coefficient (2015): 57.1%
Zambia’s economy is heavily reliant on its mining sector, especially copper. However, the wealth generated from this sector hasn’t trickled down to the masses, leading to stark income inequalities.
- Key Challenges: Fluctuating global copper prices and lack of reinvestment in local communities are primary concerns.
- Bright Spots: The government’s focus on agricultural development aims to provide more equitable income opportunities.
5. Sao Tome and Principe: Island Inequalities

Gini Coefficient (2017): 56.3%
This island nation, known for its cocoa production, faces challenges typical of small island economies, such as limited diversification and vulnerability to external shocks.
- Key Challenges: Dependence on cocoa exports and limited industrialization contribute to income disparities.
- Bright Spots: Tourism and fisheries are emerging sectors that promise more equitable wealth distribution.
6. Central African Republic: Conflict and Poverty

Gini Coefficient (2008): 56.2%
The Central African Republic, despite its abundant natural resources, remains one of the world’s poorest countries. Civil unrest and political instability have exacerbated income inequalities.
- Key Challenges: Ongoing conflicts and lack of infrastructure hinder economic development.
- Bright Spots: International aid and peacekeeping efforts aim to stabilize the nation and pave the way for economic recovery.
7. Eswatini: Monarchy and Inequality

Gini Coefficient (2016): 54.6%
As per a report by Chatham House Eswatini, formerly Swaziland, is one of the world’s last absolute monarchies. The nation’s traditional and political structures have led to concentrated wealth.
- Key Challenges: High HIV/AIDS prevalence and limited economic diversification are significant concerns.
- Bright Spots: Investments in healthcare and education are seen as steps towards reducing income disparities.
8. Mozambique: Post-war Recovery
Gini Coefficient (2014): 54.0%
Emerging from decades of civil war, Mozambique faces the dual challenges of rebuilding its economy and addressing income inequalities.
- Key Challenges: Infrastructure deficits and a heavy reliance on foreign aid are pressing issues.
- Bright Spots: The discovery of vast natural gas reserves offers potential for economic growth and wealth redistribution.
9. Brazil: A Giant’s Struggle
Gini Coefficient (2019): 53.4%
Brazil, a major global economy, grapples with stark income disparities. Urban slums juxtaposed with opulent skyscrapers paint a vivid picture of this inequality.
- Key Challenges: Corruption, inadequate public services, and a complex tax system contribute to the wealth gap.
- Bright Spots: Social programs like Bolsa Família aim to alleviate poverty and reduce income disparities.
10. Belize: Paradise with Disparities

Gini Coefficient (1999): 53.3%
Belize, known for its pristine beaches and coral reefs, faces economic challenges that have led to income inequalities.
- Key Challenges: Limited industrialization and dependence on tourism make the economy vulnerable.
- Bright Spots: Efforts to promote sustainable tourism and agriculture offer hope for a more equitable future.
Lowest Gini Coefficients
On the other end of the spectrum, Slovenia recorded the lowest Gini coefficient in 2018, at 24.6%. Other countries with low Gini coefficients include the Czech Republic, Slovakia, Belarus, and Moldova. It’s noteworthy that Nordic and Central Eastern European countries dominate this list, with seven out of the top ten slots. This dominance underscores the generally lower inequality levels in Europe compared to other parts of the world.
| Country | Year | Gini Coefficient (%) |
|---|---|---|
| Slovenia | 2018 | 24.6 |
| Czech Republic | 2018 | 25.0 |
| Slovakia | 2018 | 25.0 |
| Belarus | 2019 | 25.3 |
| Moldova | 2018 | 25.7 |
| United Arab Emirates | 2018 | 26.0 |
| Iceland | 2017 | 26.1 |
| Azerbaijan | 2005 | 26.6 |
| Ukraine | 2019 | 26.6 |
| Belgium | 2018 | 27.2 |
1. Slovenia: A European Model
Gini Coefficient (2018): 24.6%
As I read on report by OECD Slovenia, a small Central European nation, boasts a robust social welfare system and a commitment to public services, which have played pivotal roles in ensuring income equality.
- Key Strengths: Universal healthcare, free education, and a strong pension system have ensured a safety net for all citizens.
- Challenges: While income distribution is equitable, Slovenia faces challenges related to an aging population and public sector inefficiencies.
2. Czech Republic: Prosperity in Central Europe

Gini Coefficient (2018): 25.0%
The Czech Republic’s transformation from a communist state to a thriving market economy has been accompanied by policies ensuring income equality.
- Key Strengths: A diversified economy, robust industrial sector, and comprehensive social security system contribute to its low Gini coefficient.
- Challenges: The nation grapples with regional disparities and an aging workforce.
3. Slovakia: Rapid Progress, Equitable Growth
Gini Coefficient (2018): 25.0%
According to europa.eu Slovakia’s rapid economic growth post-independence has been inclusive, with policies aimed at reducing income disparities.
- Key Strengths: Investments in education, healthcare, and infrastructure have ensured that growth benefits are widespread.
- Challenges: The nation needs to address regional disparities and improve public sector efficiency.
4. Belarus: The Eastern European Enigma
Gini Coefficient (2019): 25.3%
Belarus, often termed as “Europe’s last dictatorship,” has managed to maintain a low Gini coefficient, reflecting its Soviet legacy and state-controlled economy.
- Key Strengths: State ownership of major industries and a focus on social welfare have ensured equitable income distribution.
- Challenges: Economic diversification and political reforms are areas of concern.
5. Moldova: Surprising Equitability

Gini Coefficient (2018): 25.7%
Despite being one of Europe’s poorest nations, Moldova has managed to maintain a relatively equitable income distribution.
- Key Strengths: Remittances from abroad and agricultural reforms have played roles in ensuring income equality.
- Challenges: Economic diversification and reducing dependence on remittances are pressing issues.
6. United Arab Emirates: Oil Wealth and Beyond
Gini Coefficient (2018): 26.0%
The UAE, known for its oil wealth, has diversified its economy, ensuring that prosperity is not limited to a select few says the IMF.
- Key Strengths: Investments in infrastructure, tourism, and finance have broadened the economic base.
- Challenges: Ensuring sustainable growth and addressing expatriate-native income disparities are areas of focus.
7. Iceland: Nordic Excellence
Gini Coefficient (2017): 26.1%
Iceland, with its small population and vast resources, has ensured that prosperity is widespread.
- Key Strengths: A focus on sustainable fisheries, tourism, and renewable energy has driven equitable growth.
- Challenges: Addressing the impacts of rapid tourism growth and ensuring sustainable fisheries are priorities.
8. Azerbaijan: Oil, Gas, and Beyond

Gini Coefficient (2005): 26.6%
Azerbaijan’s oil and gas wealth has been a double-edged sword, driving growth but also posing challenges for income distribution.
- Key Strengths: Investments in infrastructure and efforts to diversify the economy have been positive steps.
- Challenges: Reducing dependence on oil and gas revenues and addressing regional disparities are critical.
9. Ukraine: Post-Soviet Transformation
Gini Coefficient (2019): 26.6%
Ukraine’s journey post-independence has been tumultuous, but efforts have been made to ensure income equality.
- Key Strengths: Agricultural reforms and a diversified industrial base have been positive drivers.
- Challenges: Political instability and economic reforms remain areas of concern.
10. Belgium: A European Beacon
Gini Coefficient (2018): 27.2%
Belgium’s strong social welfare system and progressive taxation policies have ensured that income disparities remain low, according to OECD.
- Key Strengths: A diversified economy, robust healthcare system, and focus on education have driven equitable growth.
- Challenges: Addressing regional disparities and ensuring sustainable public finances are areas of focus.
The Global Perspective
The Gini coefficient is not just a measure; it’s a reflection of global economic dynamics, historical events, and policy decisions.
- Historical Trends: The Gini coefficient witnessed consistent growth during the 19th and 20th centuries. In 1820, the global Gini coefficient stood at 0.50, and by 1992, it had risen to 0.657. Such trends are indicative of the increasing income disparities that have shaped the world over the past two centuries.
- Impact of Epidemics: Major epidemics have historically influenced the Gini coefficient. According to the World Bank’s Poverty and Shared Prosperity 2020 report, the Gini coefficient tends to rise by about 1.5 points in the five years following significant epidemics, such as H1N1 (2009), Ebola (2014), and Zika (2016). While the ramifications of the COVID-19 pandemic are still being assessed, preliminary estimates anticipated a Gini coefficient surge of 1.2-1.9 percentage points annually for 2020 and 2021, indicating escalating income inequality.
The United States and the Gini Coefficient
The United States, one of the world’s major economies, has its own unique relationship with the Gini coefficient.
- Current Standing: The United States has a Gini coefficient of 41.1. This figure is indicative of the income disparities within the country. In 2015, the top 1% of earners in the U.S. had an average income 40 times greater than the bottom 90%.
- Growing Concerns: Poverty is an escalating issue in the U.S., with an estimated 12.3-17.8% of the population living below the poverty line. Many of these low-wage workers live from paycheck to paycheck, lacking benefits like sick days, pensions, or health insurance. Such realities underscore the pressing need for policies that address income inequality in the country.
Europe: A Beacon of Lower Inequality?
Europe, particularly its Nordic and Central Eastern regions, often stands out for its lower Gini coefficients.
- European Dominance: As mentioned earlier, seven of the top ten countries with the lowest Gini coefficients are from Europe. This dominance is a testament to the continent’s relatively equitable income distribution.
- Reasons for Lower Inequality: Several factors contribute to Europe’s lower Gini coefficients. These include robust social welfare systems, progressive taxation policies, and a history of labor rights movements that have championed equitable wages. Additionally, cultural values emphasizing community and solidarity have played a role in shaping policies that promote income equality.
FAQ
What is the ideal Gini coefficient for a country?
There isn’t an “ideal” Gini coefficient as it largely depends on a country’s socio-economic goals. However, a lower Gini coefficient indicates more equitable income distribution.
How often is the Gini coefficient updated?
The frequency varies by country and the organization collecting the data. The World Bank, for instance, updates its data annually, but the actual year of the data might vary for each country.
Can the Gini coefficient be negative?
No, the Gini coefficient ranges between 0 (perfect equality) and 1 (perfect inequality).
Does a low Gini coefficient mean a country is wealthy?
Not necessarily. A low Gini coefficient indicates income equality, but the country could still have a low average income.
How does taxation impact the Gini coefficient?
Progressive taxation can reduce income inequality, leading to a lower Gini coefficient, while regressive taxation can have the opposite effect.
Are there other measures of income inequality besides the Gini coefficient?
Yes, other measures include the Palma ratio, the 20/20 ratio, and the Theil index, among others.
How does the Gini coefficient relate to social mobility?
Countries with a high Gini coefficient often have lower social mobility, meaning it’s harder for individuals to move between income classes.
Final Words
Income inequality, as measured by the Gini coefficient, is a reflection of a nation’s socio-economic fabric. While the coefficient provides a snapshot, the stories behind the numbers are intricate, shaped by history, policies, and societal values. Addressing these disparities is not just an economic imperative but a testament to a nation’s commitment to fairness and opportunity for all.
References
1. Corporate Finance Institution
- Link
- A comprehensive resource that provides insights into various financial metrics, including the Gini coefficient. It offers a deep understanding of income distribution measures.
2. UNCTAD
- Link
- The United Nations Conference on Trade and Development offers a global perspective on economic trends, including the limitations of the Gini coefficient.
3. World Bank
- Link
- A trusted global institution that provides data on various economic indicators, including the Gini coefficient. Their reports shed light on income inequality trends across countries.
4. Trading Economics
- Link
- Provides real-time economic data and insights. Their analysis of South Africa’s unemployment rates and other economic challenges is invaluable.
5. Chatham House
- Link
- An international affairs think tank that offers insights into global political and economic dynamics. Their report on Eswatini provides a deep dive into the nation’s traditional and political structures.
6. OECD
- Link
- The Organisation for Economic Co-operation and Development provides data and analysis on a broad range of economic indicators. Their reports on Slovenia and Belgium offer insights into the factors driving low Gini coefficients in these countries.
7. Europa.eu
- Link
- The official website of the European Union offers insights into the economic and social policies of member states. Their analysis of Slovakia’s post-independence economic growth is particularly enlightening.