Every city has its rhythm, and nowhere is this more evident than on its roads. From the swift streets of San Diego to the congested corners of London, let’s embark on a journey that takes us through the world’s traffic patterns, from the fastest to the slowest.
Along the way, I’ll pepper in some personal anecdotes, intriguing facts, and figures to give you a comprehensive view of urban mobility.
1. San Diego, USA ?? – 8 min 40 s
Our journey begins in San Diego, where the Pacific breeze seems to push vehicles along, allowing one to cover 10 kilometers in a mere 8 minutes and 40 seconds.
The city’s expansive roadways and efficient traffic management make it a driver’s dream.
2. Dubai, UAE ?? – 12 min 10 s
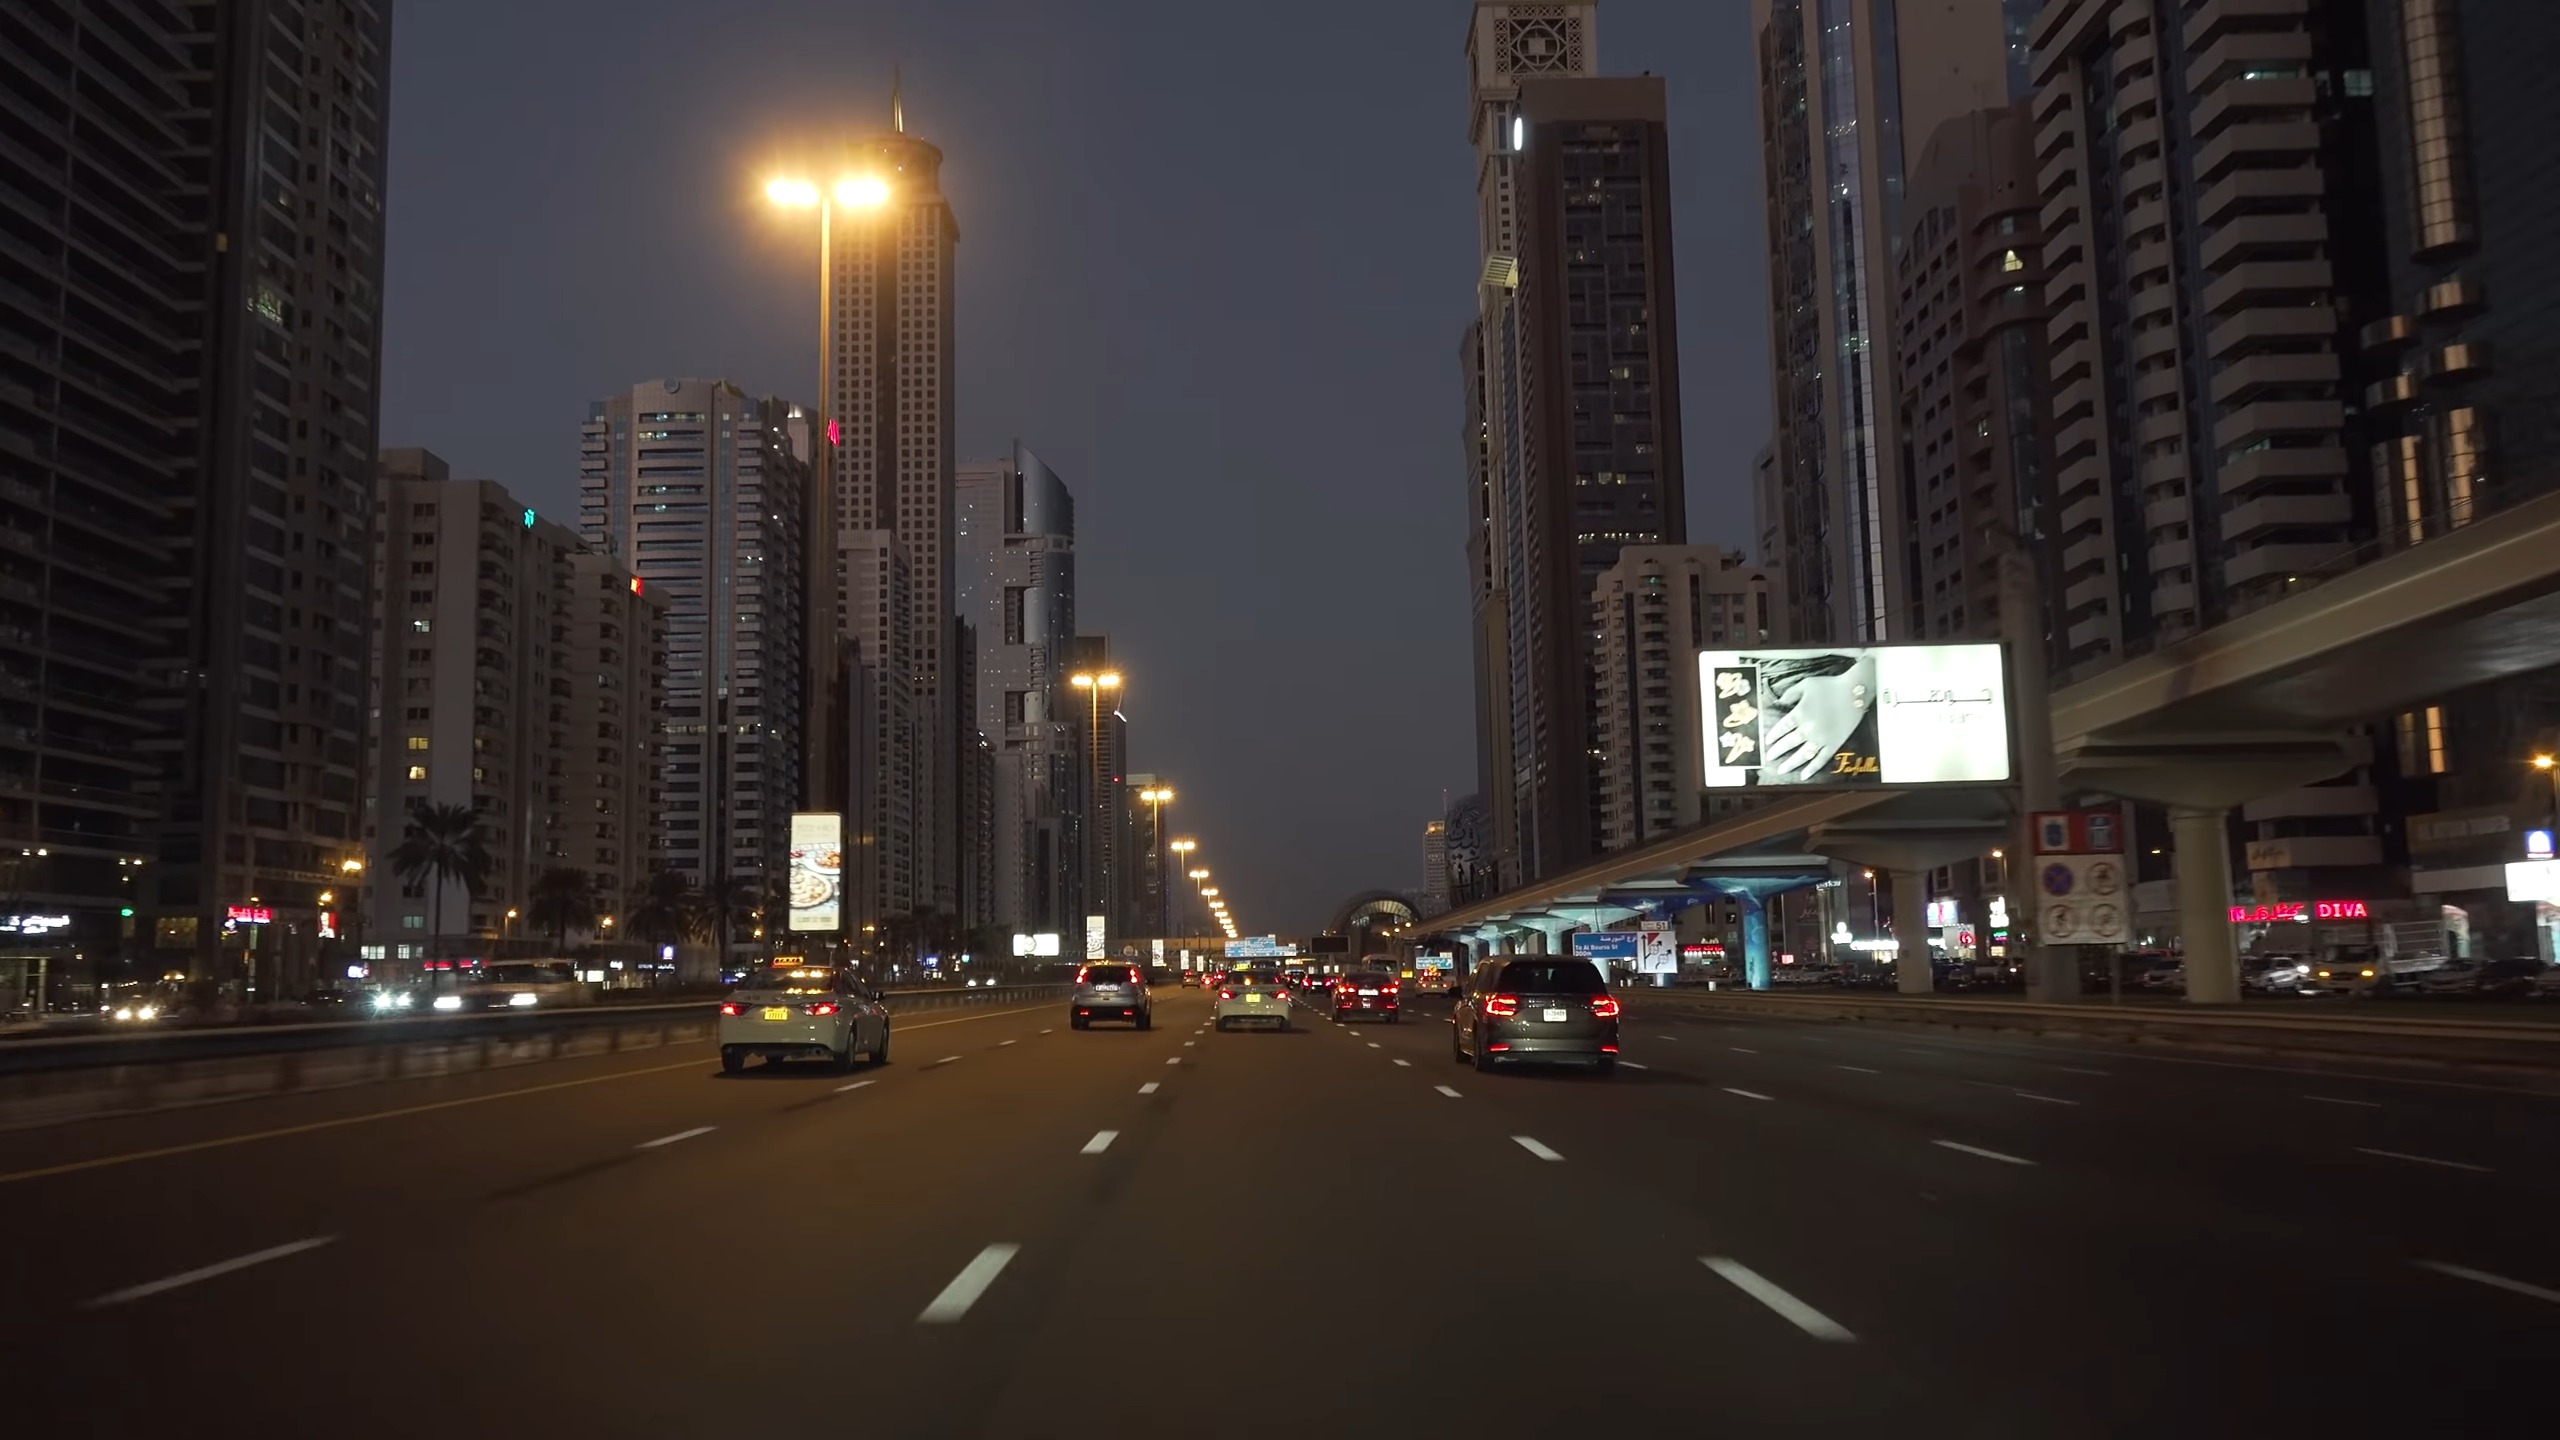
Dubai, a city synonymous with luxury, ensures its residents and visitors can traverse its lengths in just over 12 minutes for 10 kilometers. The wide highways, often flanked by towering skyscrapers, are a testament to its modern infrastructure.
3. Amsterdam, Netherlands ?? – 12 min 50 s
Amsterdam, with its intricate canal system, is next on our list. While bicycles reign supreme here, cars aren’t far behind, averaging 12 minutes and 50 seconds for 10 kilometers. The city’s commitment to sustainable transport is truly commendable.
4. Ljubljana, Slovenia ?? – 13 min 20 s
Ljubljana, a hidden European gem, offers a travel time of 13 minutes and 20 seconds. Its compact size and efficient urban planning make navigating the city a breeze.
5. Los Angeles, USA ?? – 14 min 30 s
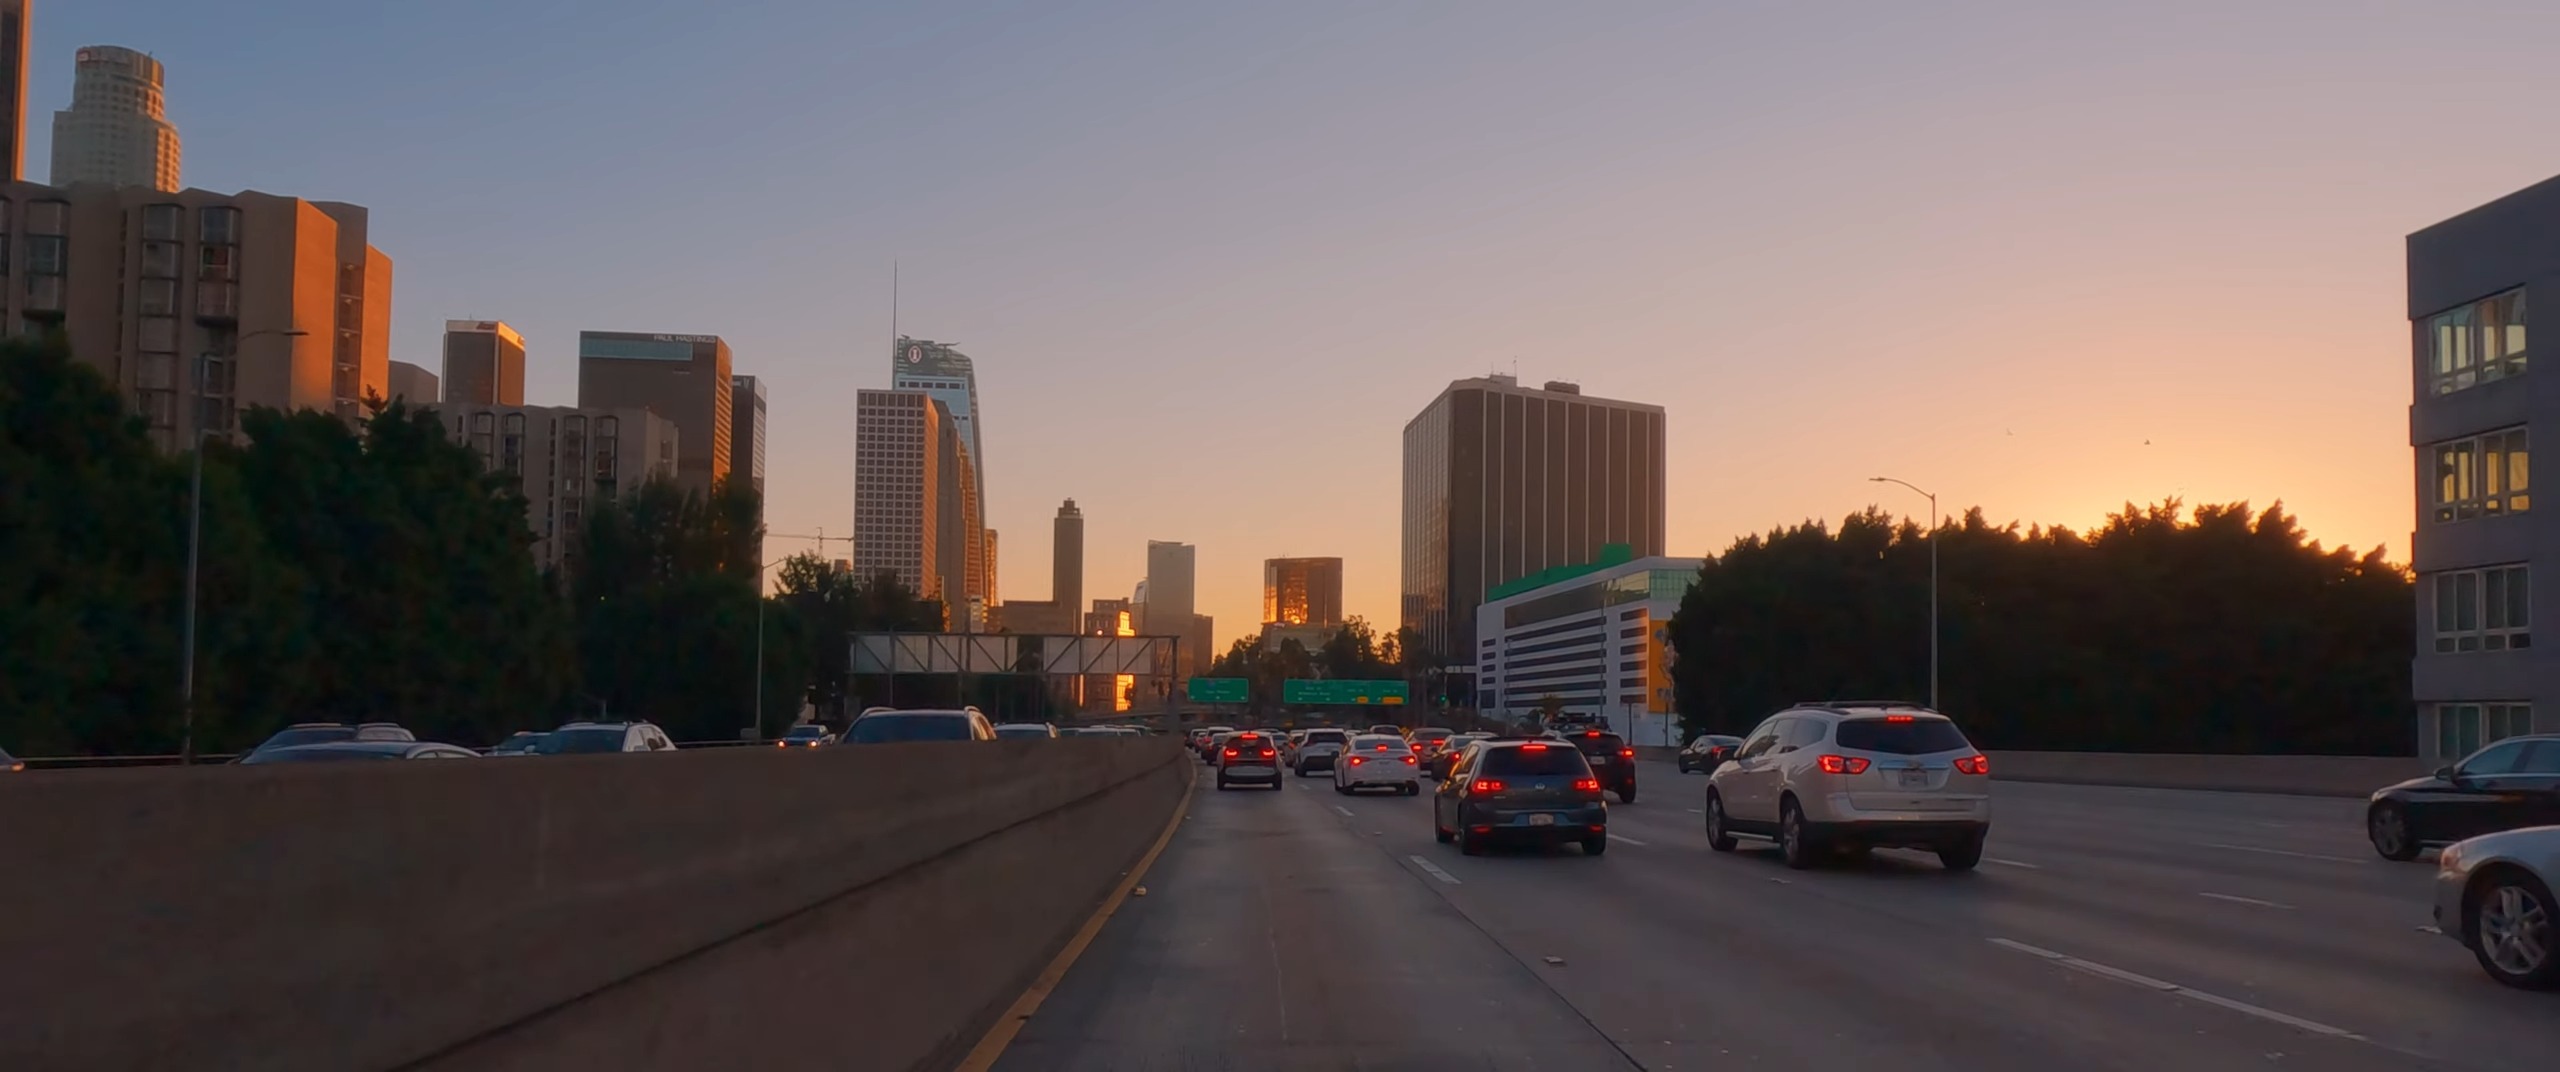
LA, the city of angels and endless highways, clocks in at 14 minutes and 30 seconds. Given its reputation for notorious traffic jams, this might come as a surprise to many.
However, outside of peak hours, the city’s extensive freeway system can be quite efficient.
6. Oslo, Norway ?? – 15 min 10 s
The Norwegian capital, with its scenic routes and fjord views, averages 15 minutes and 10 seconds. Oslo’s investment in public transport and pedestrian pathways has significantly reduced car dependency.
7. Stockholm, Sweden ?? – 15 min 20 s
Just a tad slower is Stockholm, another Nordic city that has prioritized green transportation, resulting in an average time of 15 minutes and 20 seconds.
8. Cape Town, South Africa ?? – 15 min 30 s
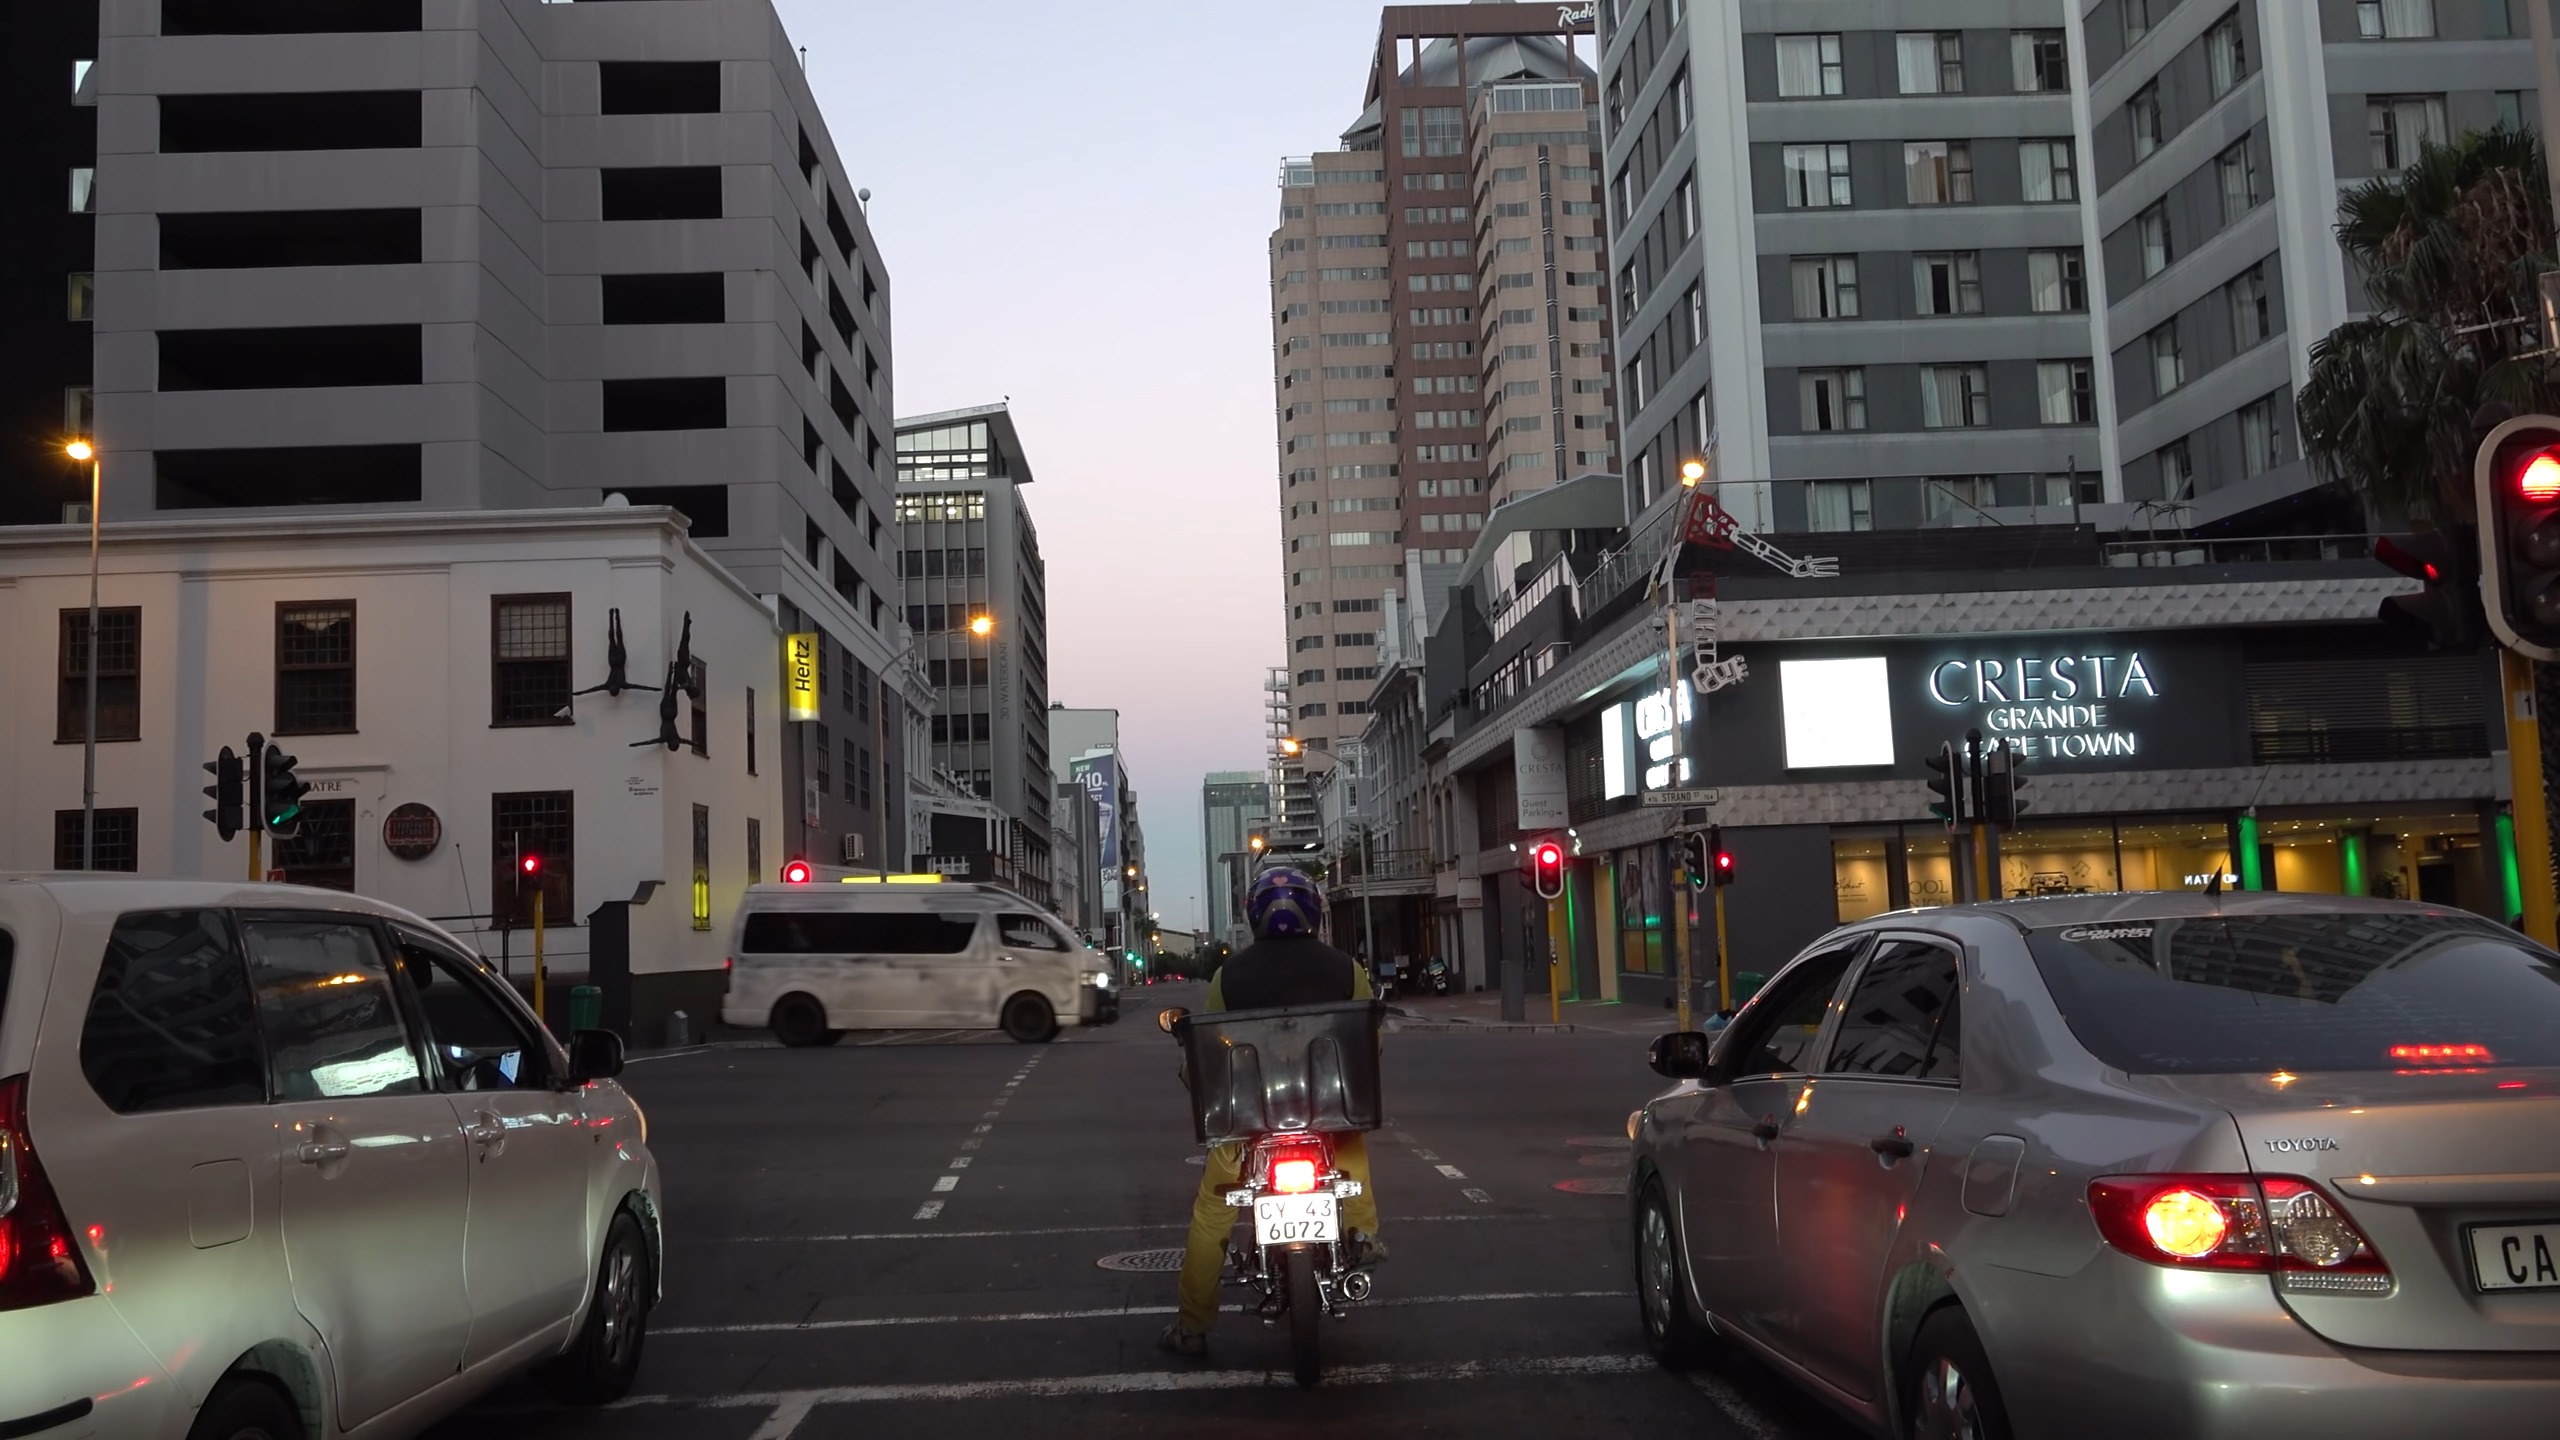
Cape Town’s diverse landscapes might distract you from the fact that you can cover 10 kilometers in just 15 minutes and 30 seconds. The city’s roadways, though busy, are well-maintained and offer breathtaking views of both mountains and the sea.
9. Riyadh, Saudi Arabia ?? – 16 min 20 s
Riyadh, a desert metropolis, has an average travel time of 16 minutes and 20 seconds. The city has been undergoing rapid development, with new roads and infrastructure projects aimed at easing congestion.
10. Barcelona, Spain ?? – 18 min 00 s
Tied with Chicago, Barcelona’s vibrant streets and historic alleys see an average travel time of 18 minutes. The city’s grid system, designed by Ildefons Cerdà, was revolutionary in its time and continues to influence urban planning worldwide.
11. Chicago, USA ?? – 18 min 00 s
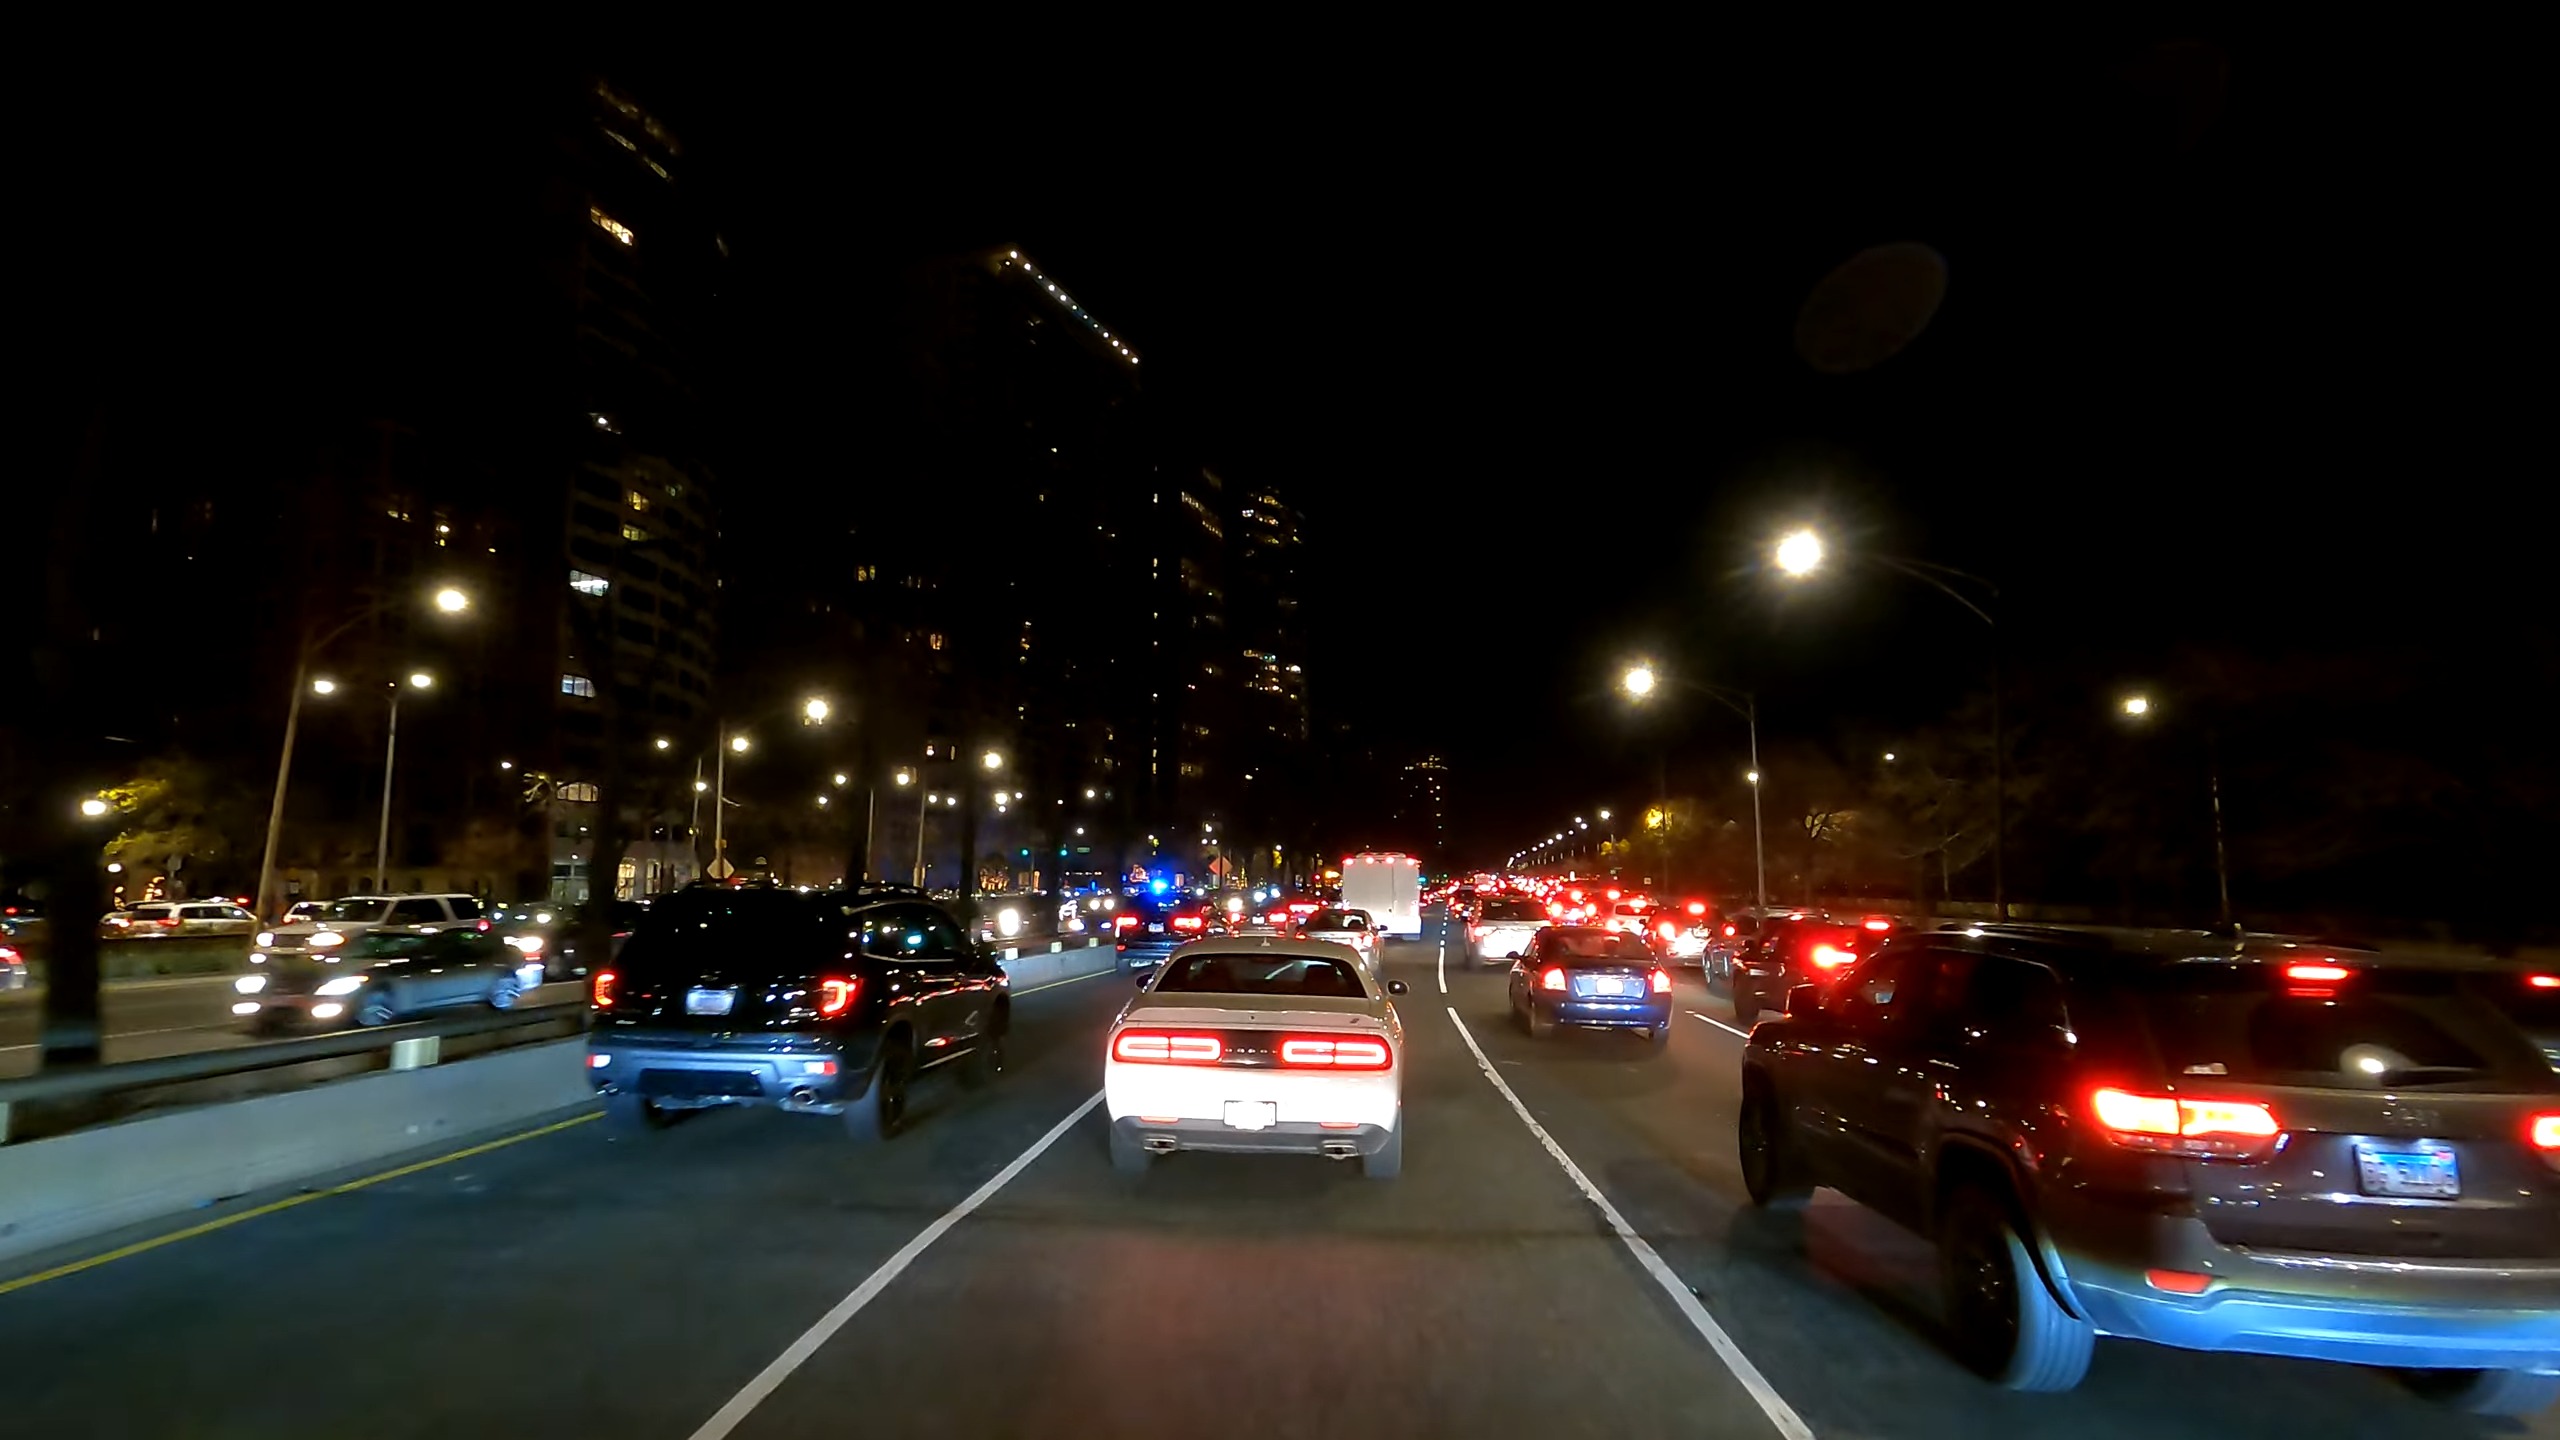
The Windy City, with its iconic lakeshore drive and bustling downtown, matches Barcelona’s time. Chicago’s extensive public transport system, including its “L” trains, plays a crucial role in decongesting its roads.
12. Tallinn, Estonia ?? – 18 min 20 s
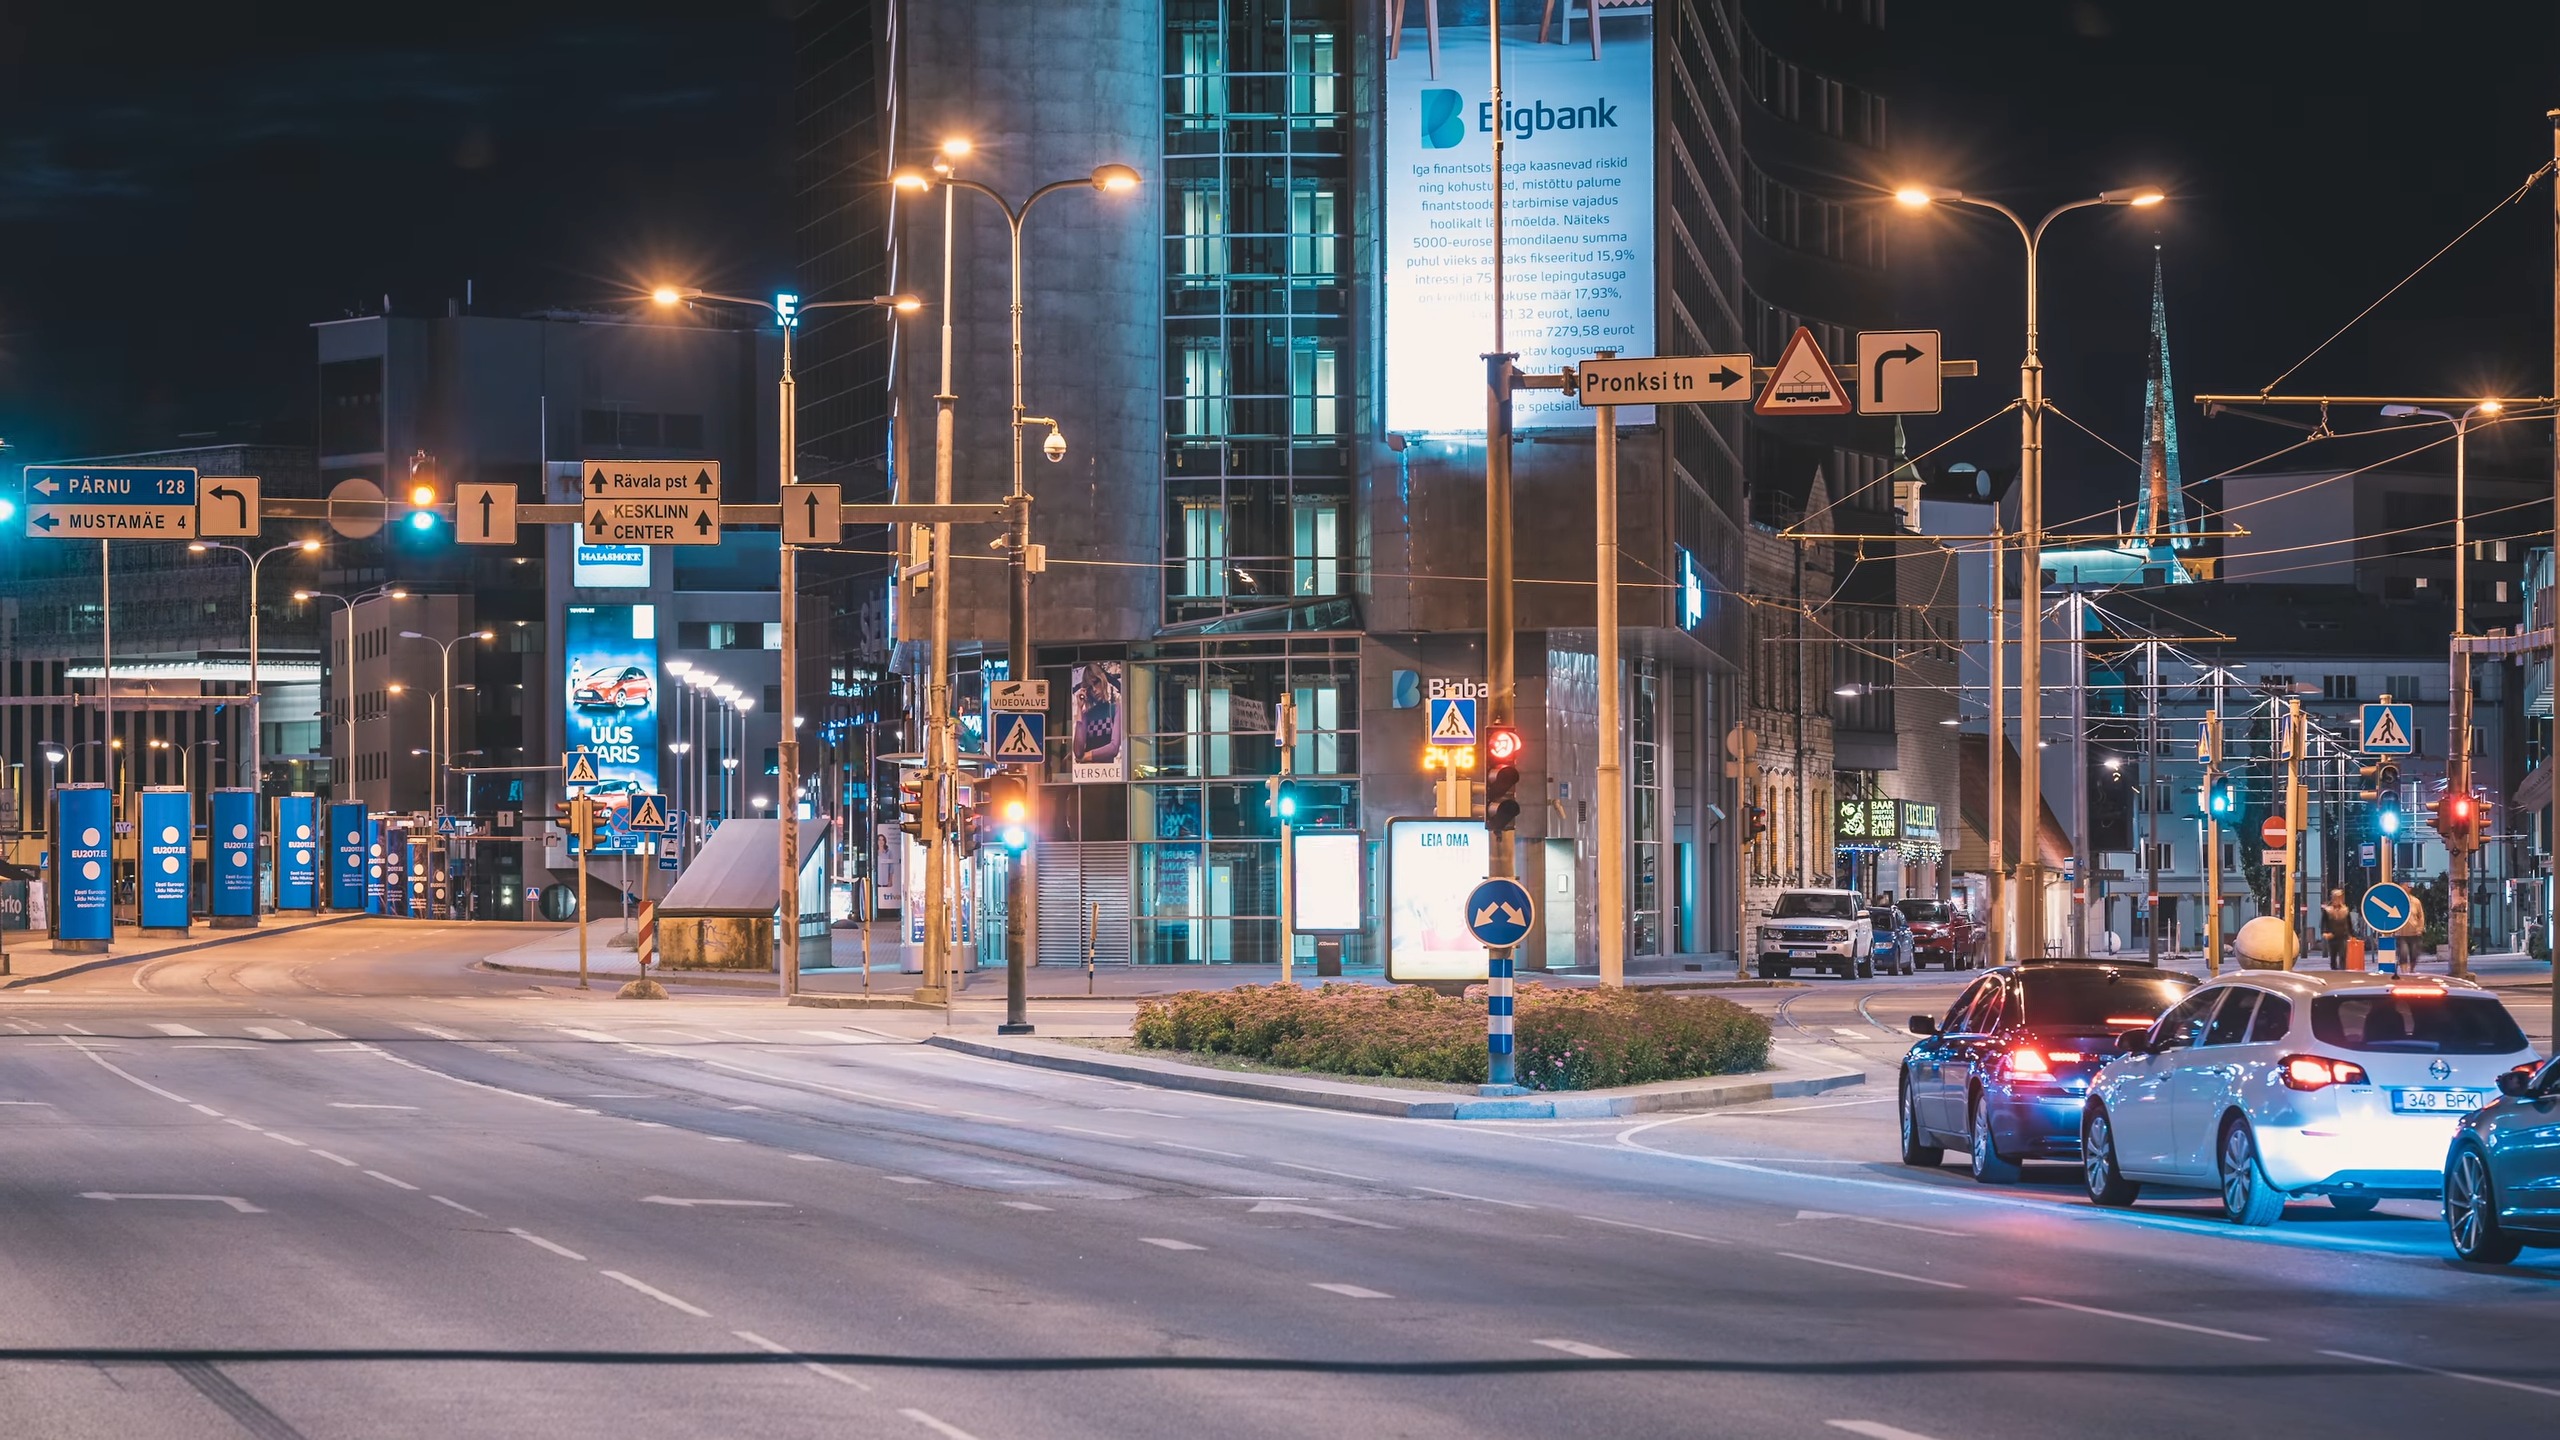
Tallinn, a blend of medieval charm and modern efficiency, clocks in at 18 minutes and 20 seconds. The city’s compact nature and well-maintained roads make for a smooth driving experience.
13. Helsinki, Finland ?? – 20 min 10 s
Helsinki, with its coastal roads and bridges, averages 20 minutes and 10 seconds. The city’s commitment to sustainable transport, including an extensive tram system, helps in managing traffic flow.
14. Istanbul, Turkey ?? – 20 min 40 s
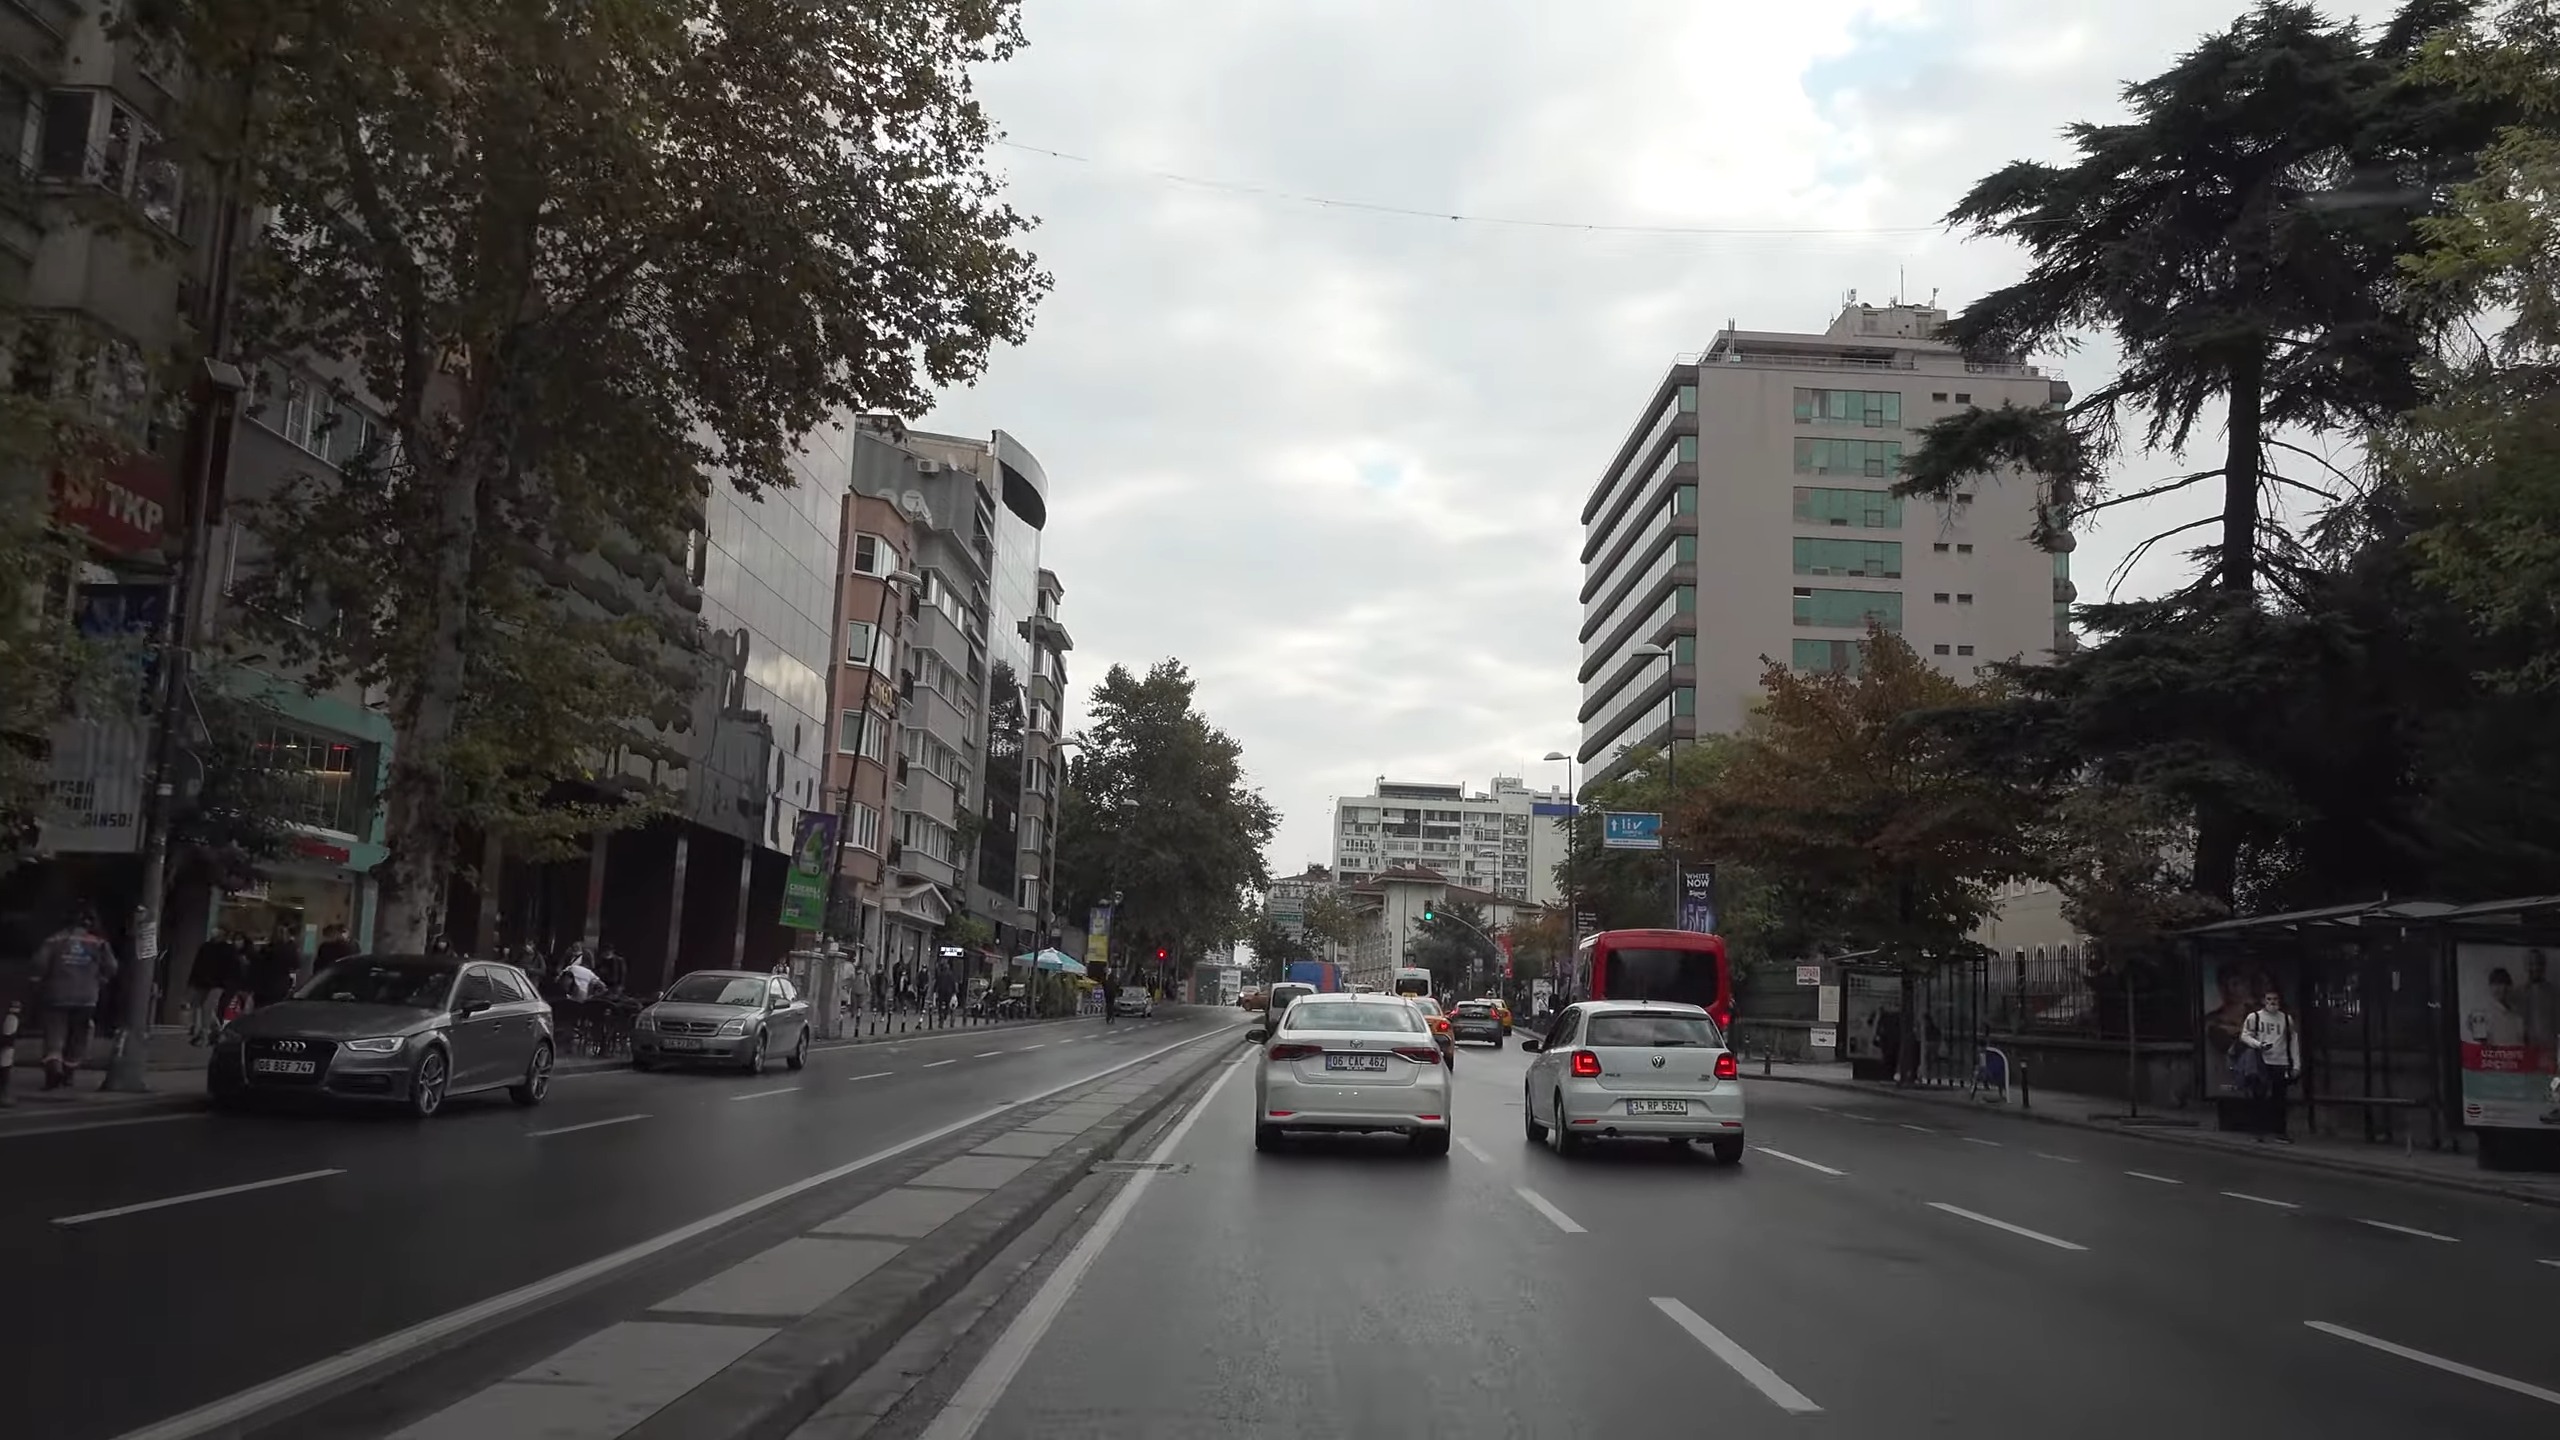
Straddling two continents, Istanbul faces unique traffic challenges. Yet, the average time remains a respectable 20 minutes and 40 seconds.
The city’s ferries, which transport both people and vehicles across the Bosphorus, are a testament to its innovative solutions to traffic management.
15. Cairo, Egypt ?? – 21 min 20 s
Cairo, known for its historical landmarks and bustling bazaars, sees an average time of 21 minutes and 20 seconds. The city’s traffic is as dynamic as its culture, with everything from cars to camels sharing the road.
16. Sydney, Australia ?? – 21 min 30 s
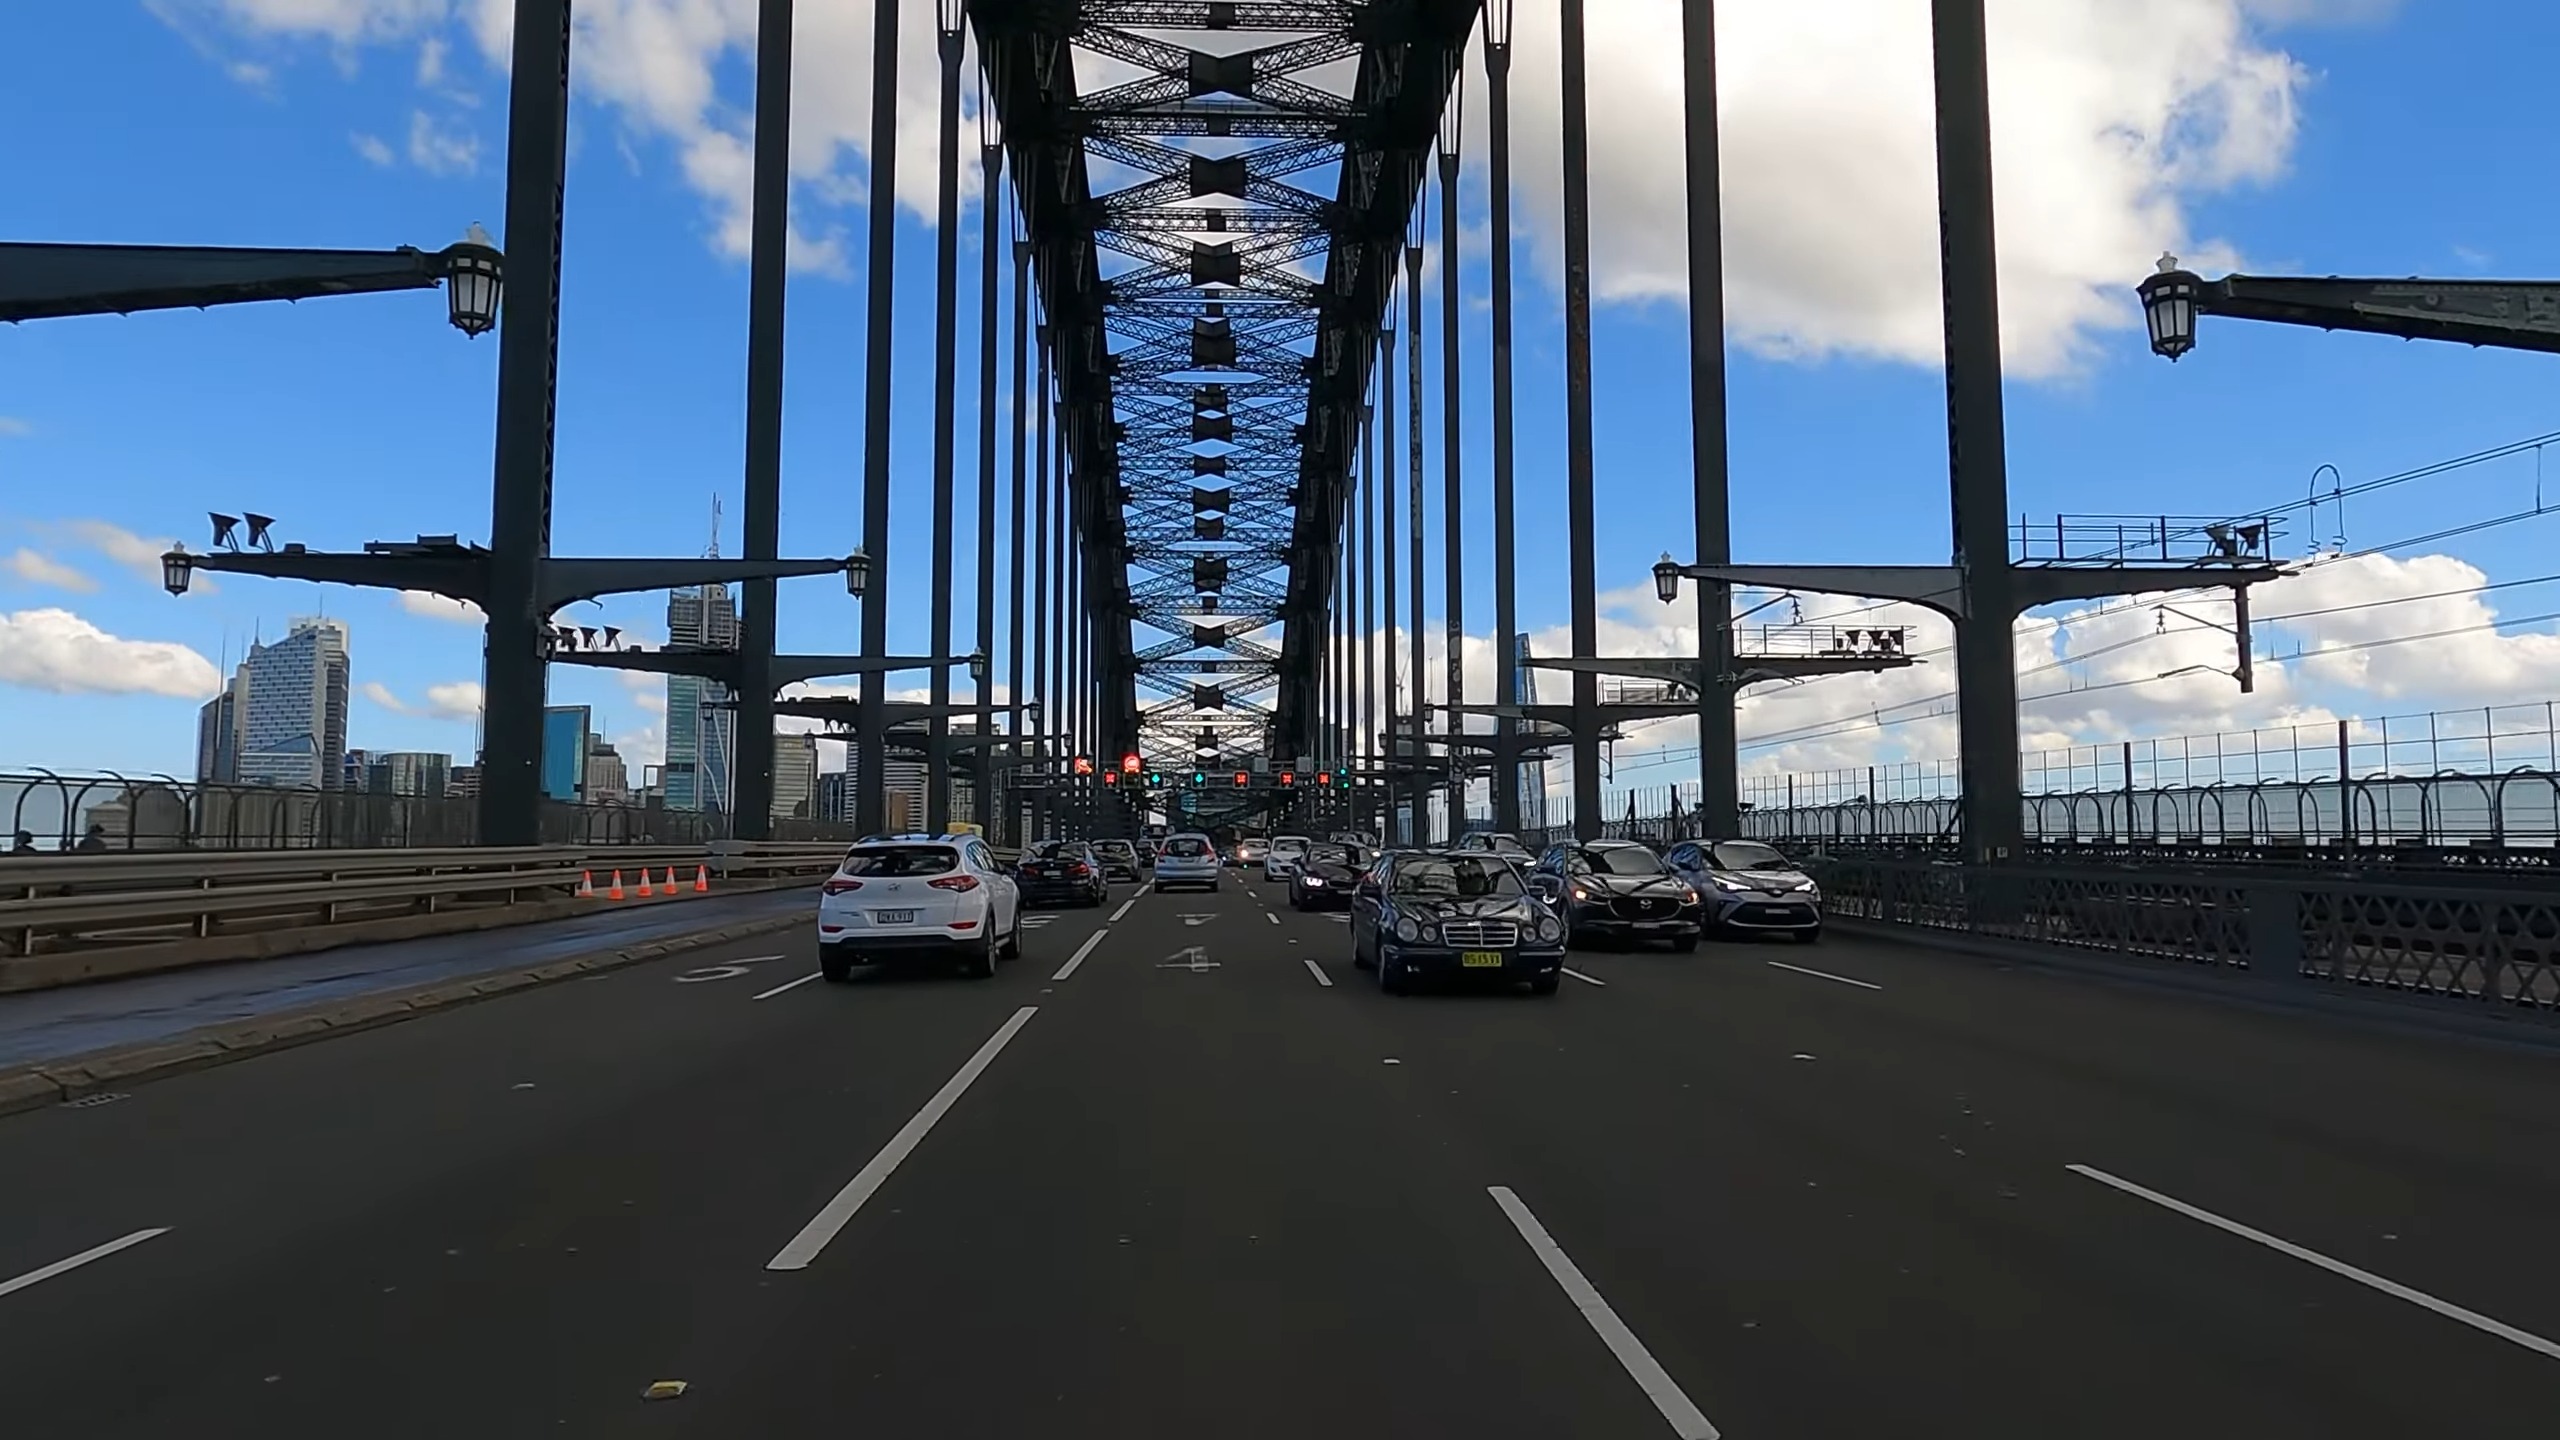
Down under in Sydney, the average travel time is 21 minutes and 30 seconds. The city’s harbor and numerous beaches mean that roads often offer scenic views, making the drive a pleasure.
17. Vienna, Austria ?? – 22 min 00 s
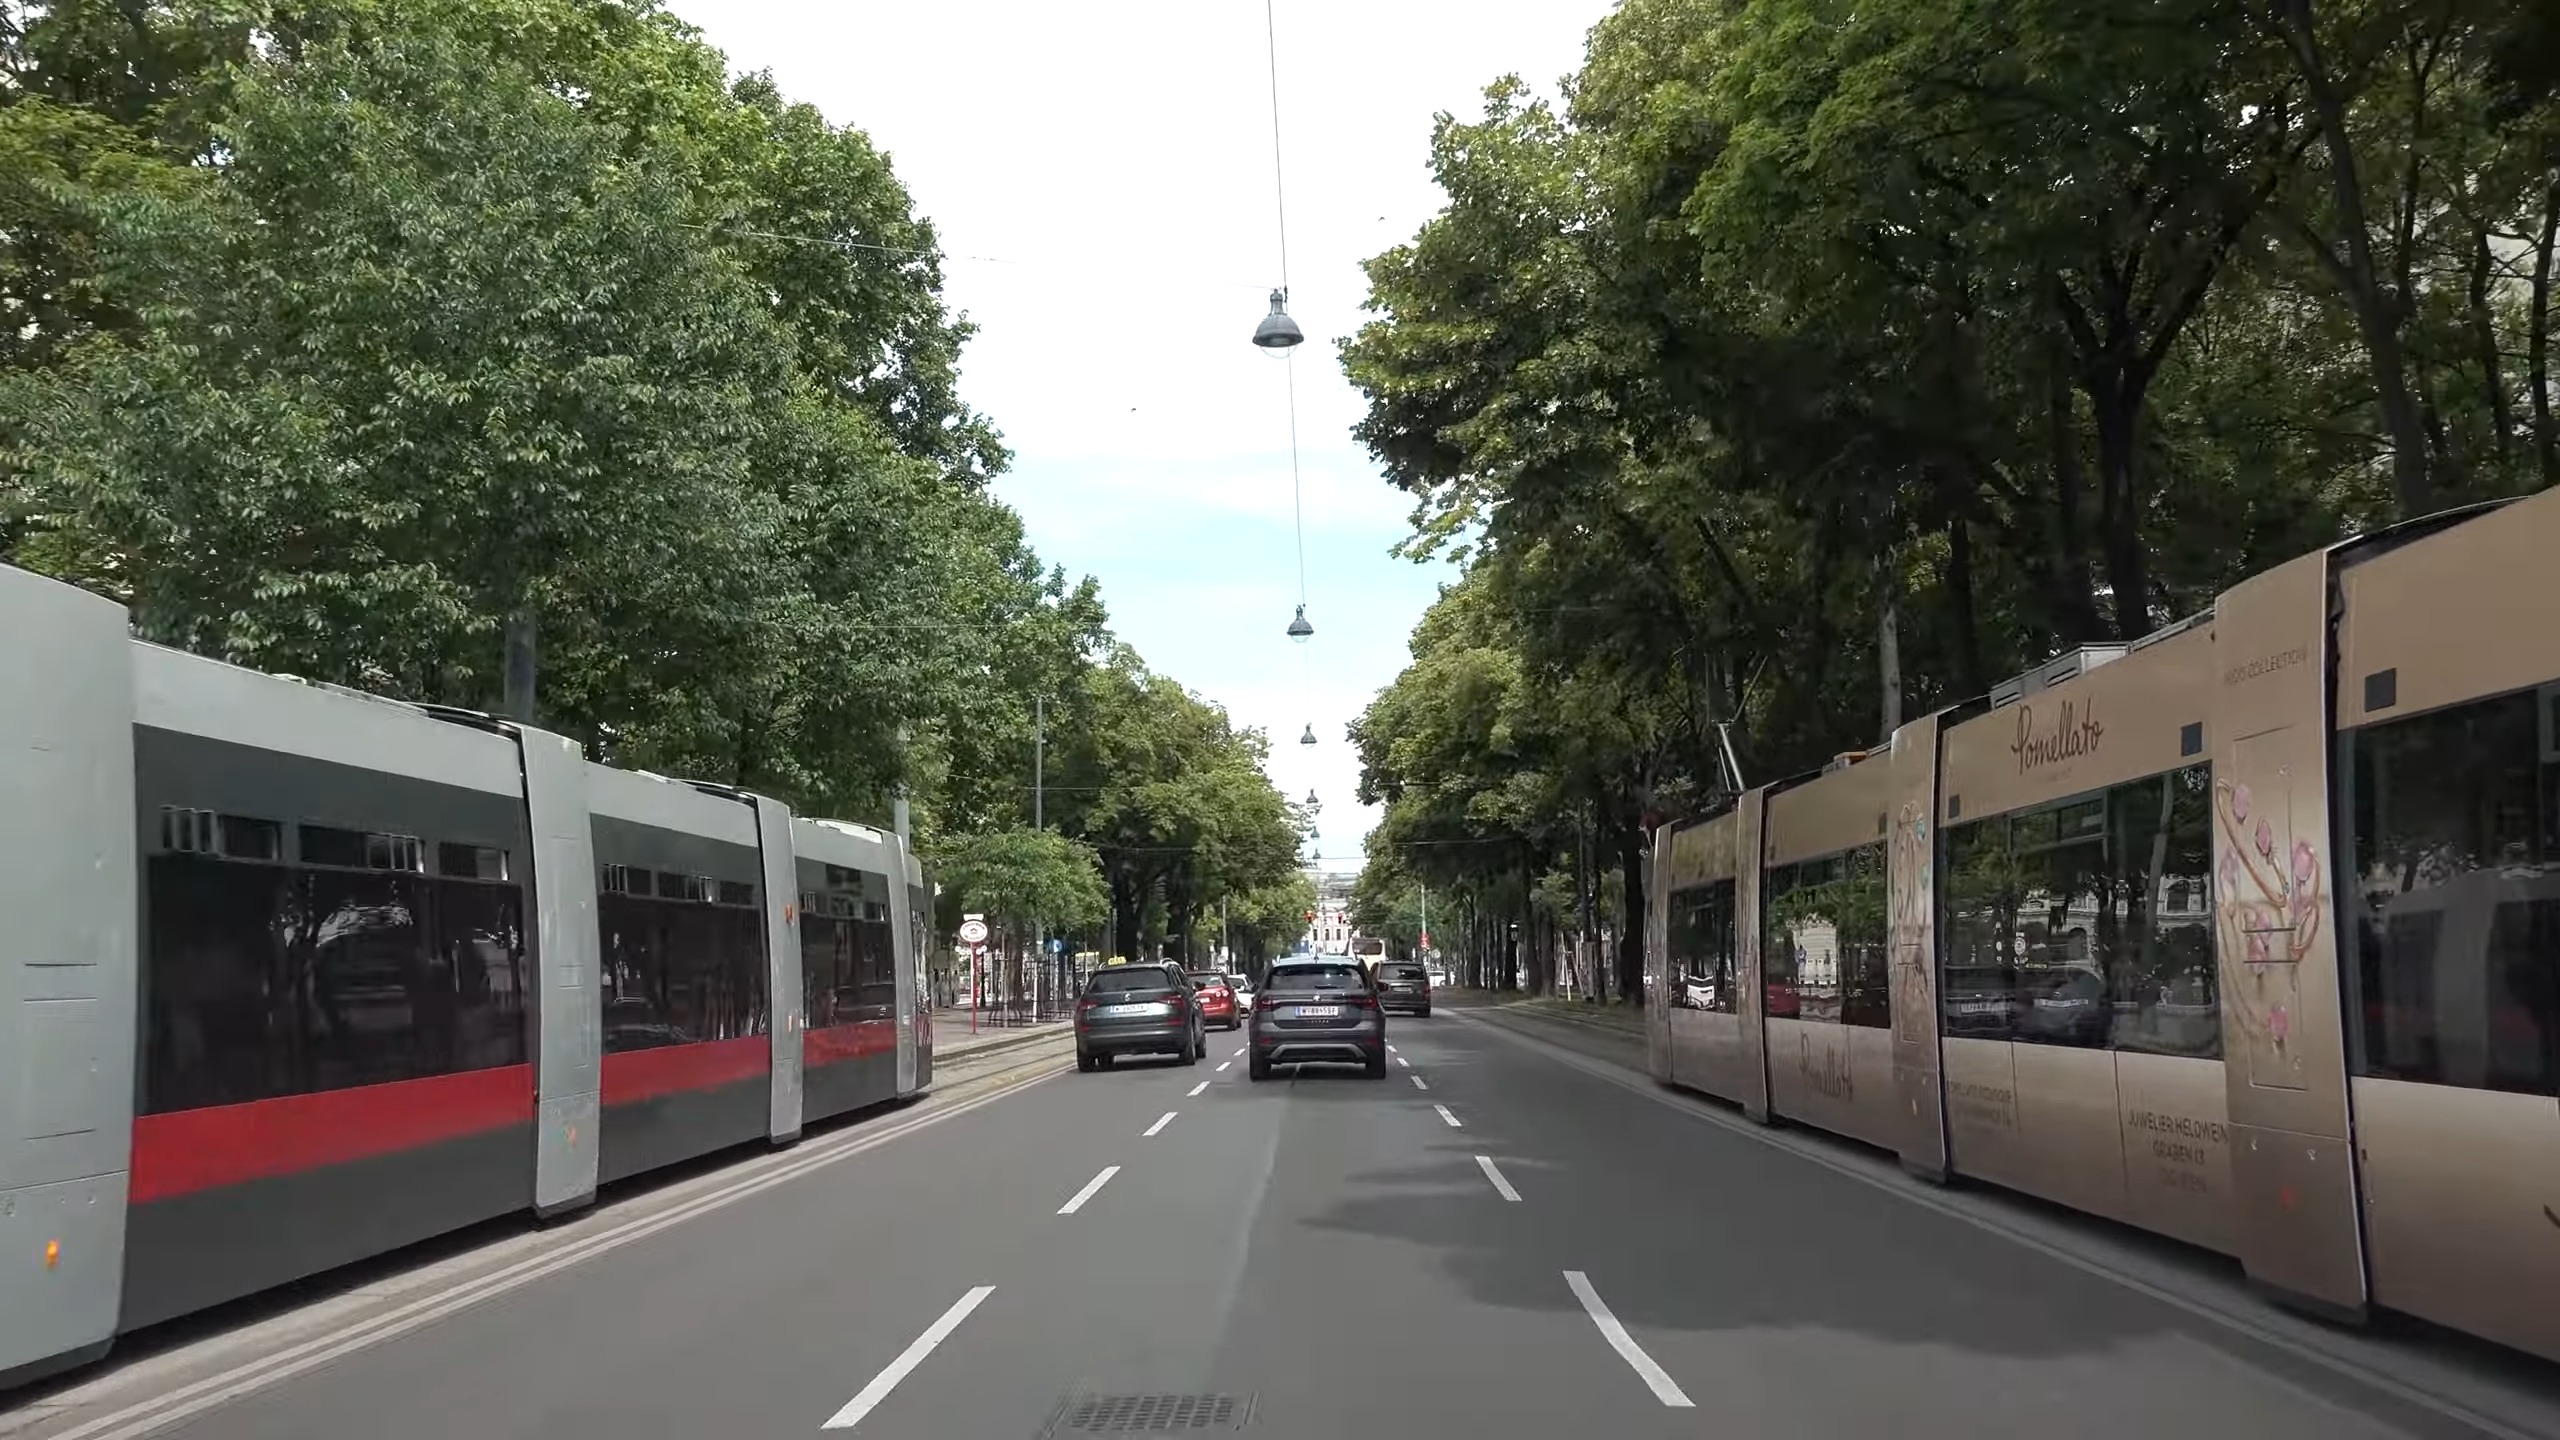
Vienna, a city known for its music and coffeehouses, averages 22 minutes. The city’s efficient public transport system, including its trams and underground, plays a significant role in keeping cars moving.
18. Berlin, Germany ?? – 22 min 10 s
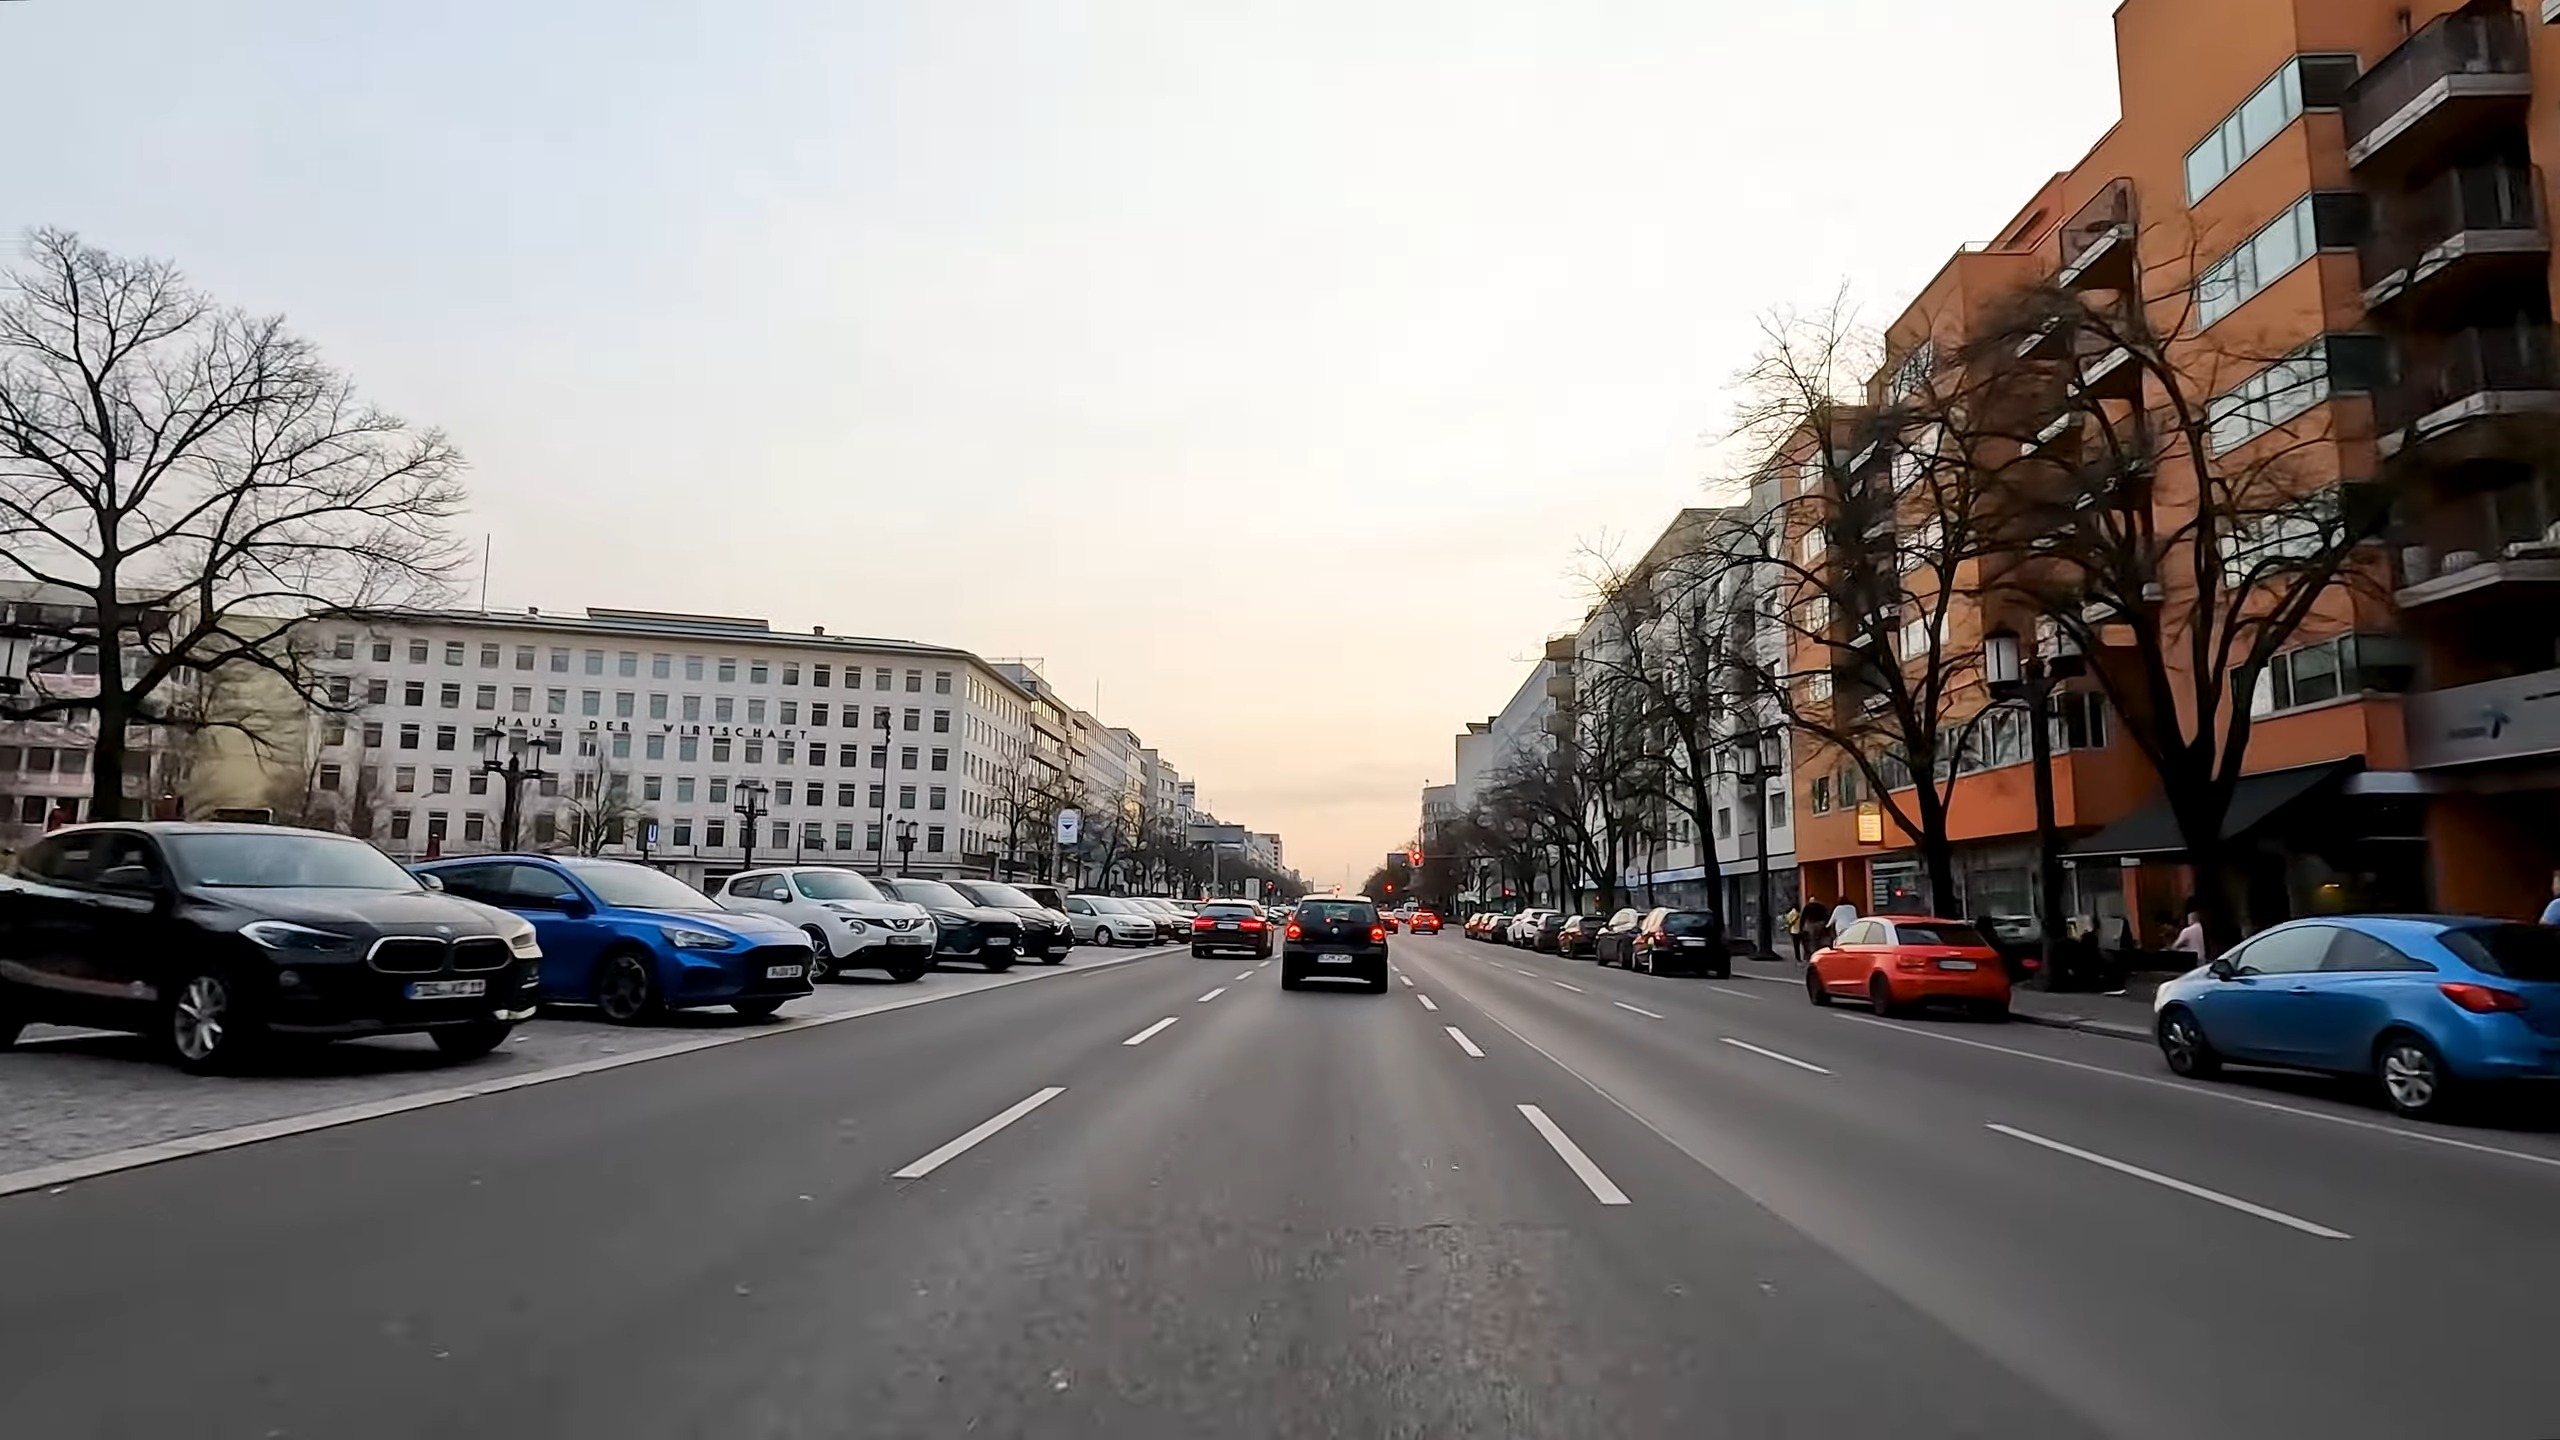
Tied with São Paulo and New Delhi, Berlin’s wide boulevards and historical sites make for an average travel time of 22 minutes and 10 seconds. The city’s commitment to green transport, including extensive bike lanes, is noteworthy.
19. São Paulo, Brazil ?? – 22 min 10 s
São Paulo, a sprawling metropolis, matches Berlin’s time. The city’s intricate mix of high-rises and green spaces presents unique traffic challenges.
20. New Delhi, India ?? – 22 min 10 s
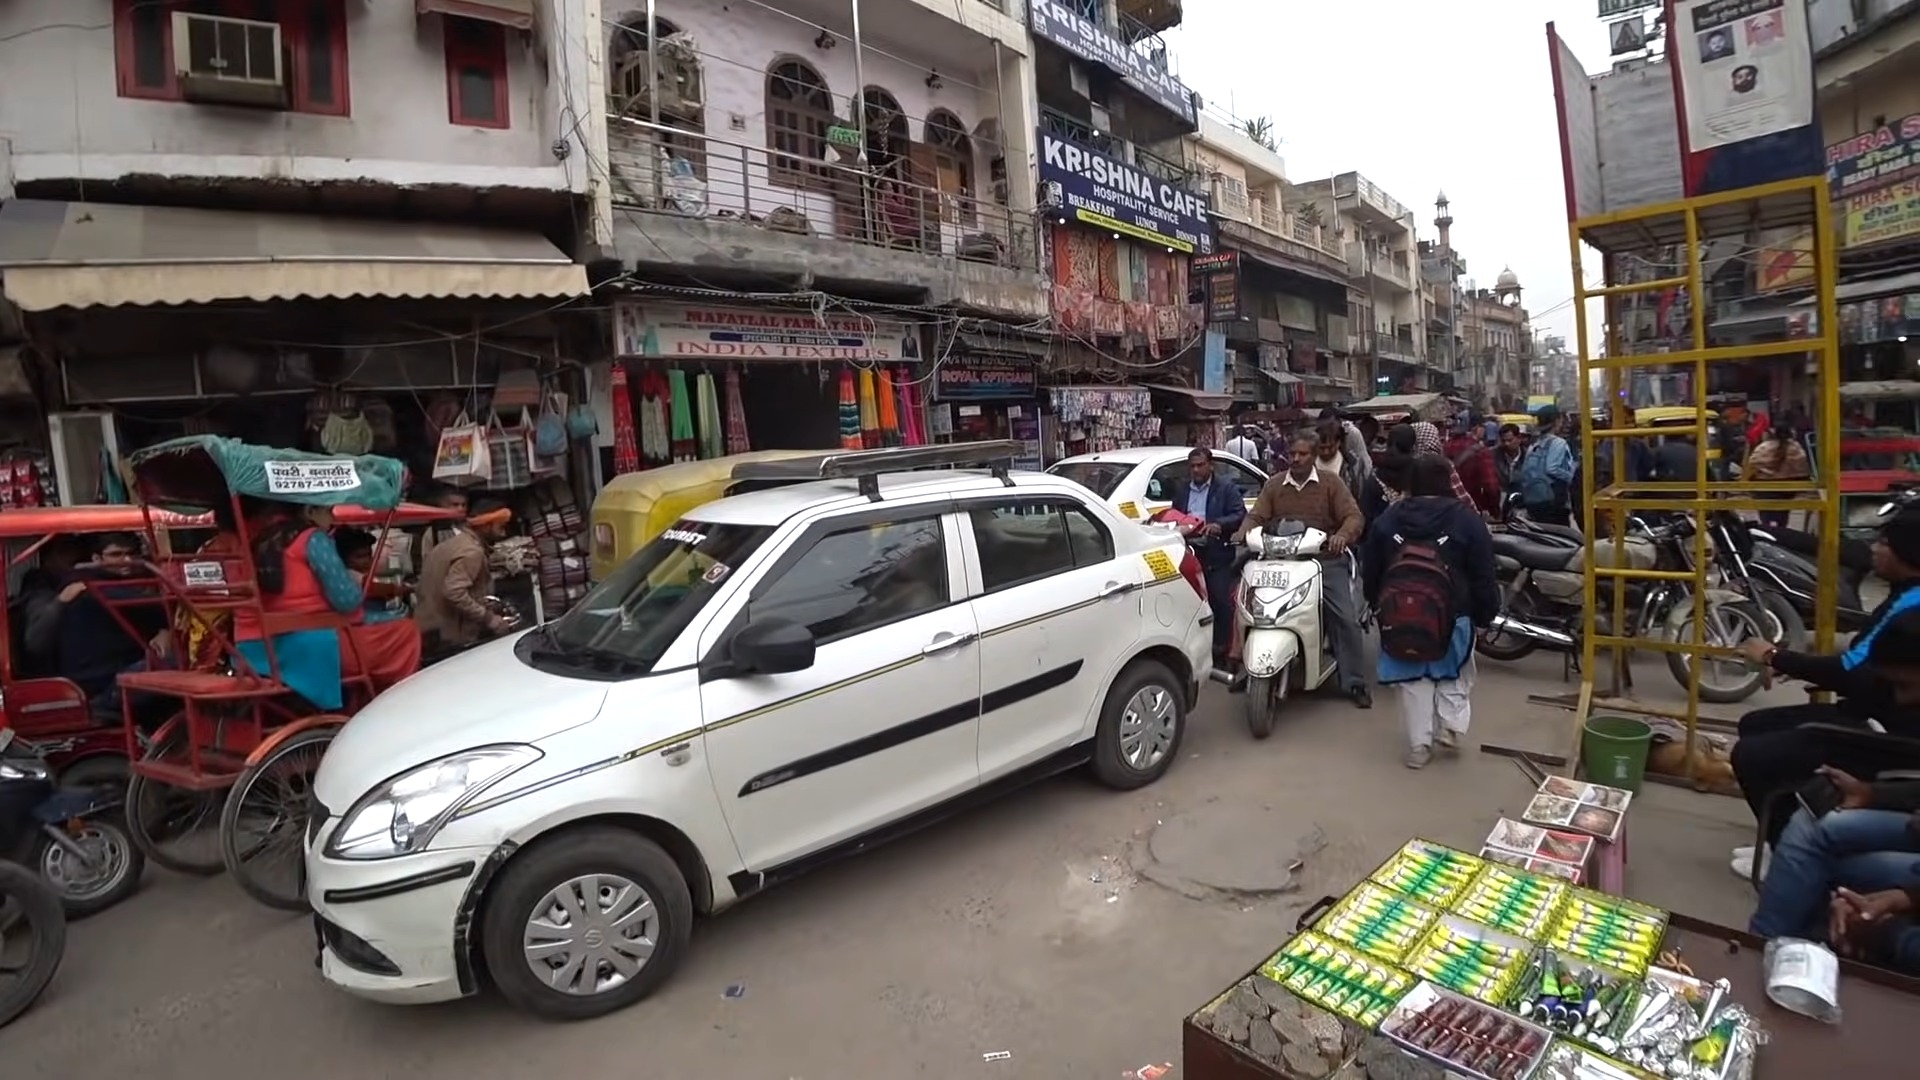
New Delhi, with its rich history and burgeoning population, also clocks in at 22 minutes and 10 seconds. The city’s recent metro expansion has been a game-changer in reducing road congestion.
21. Lodz, Poland ?? – 22 min 20 s
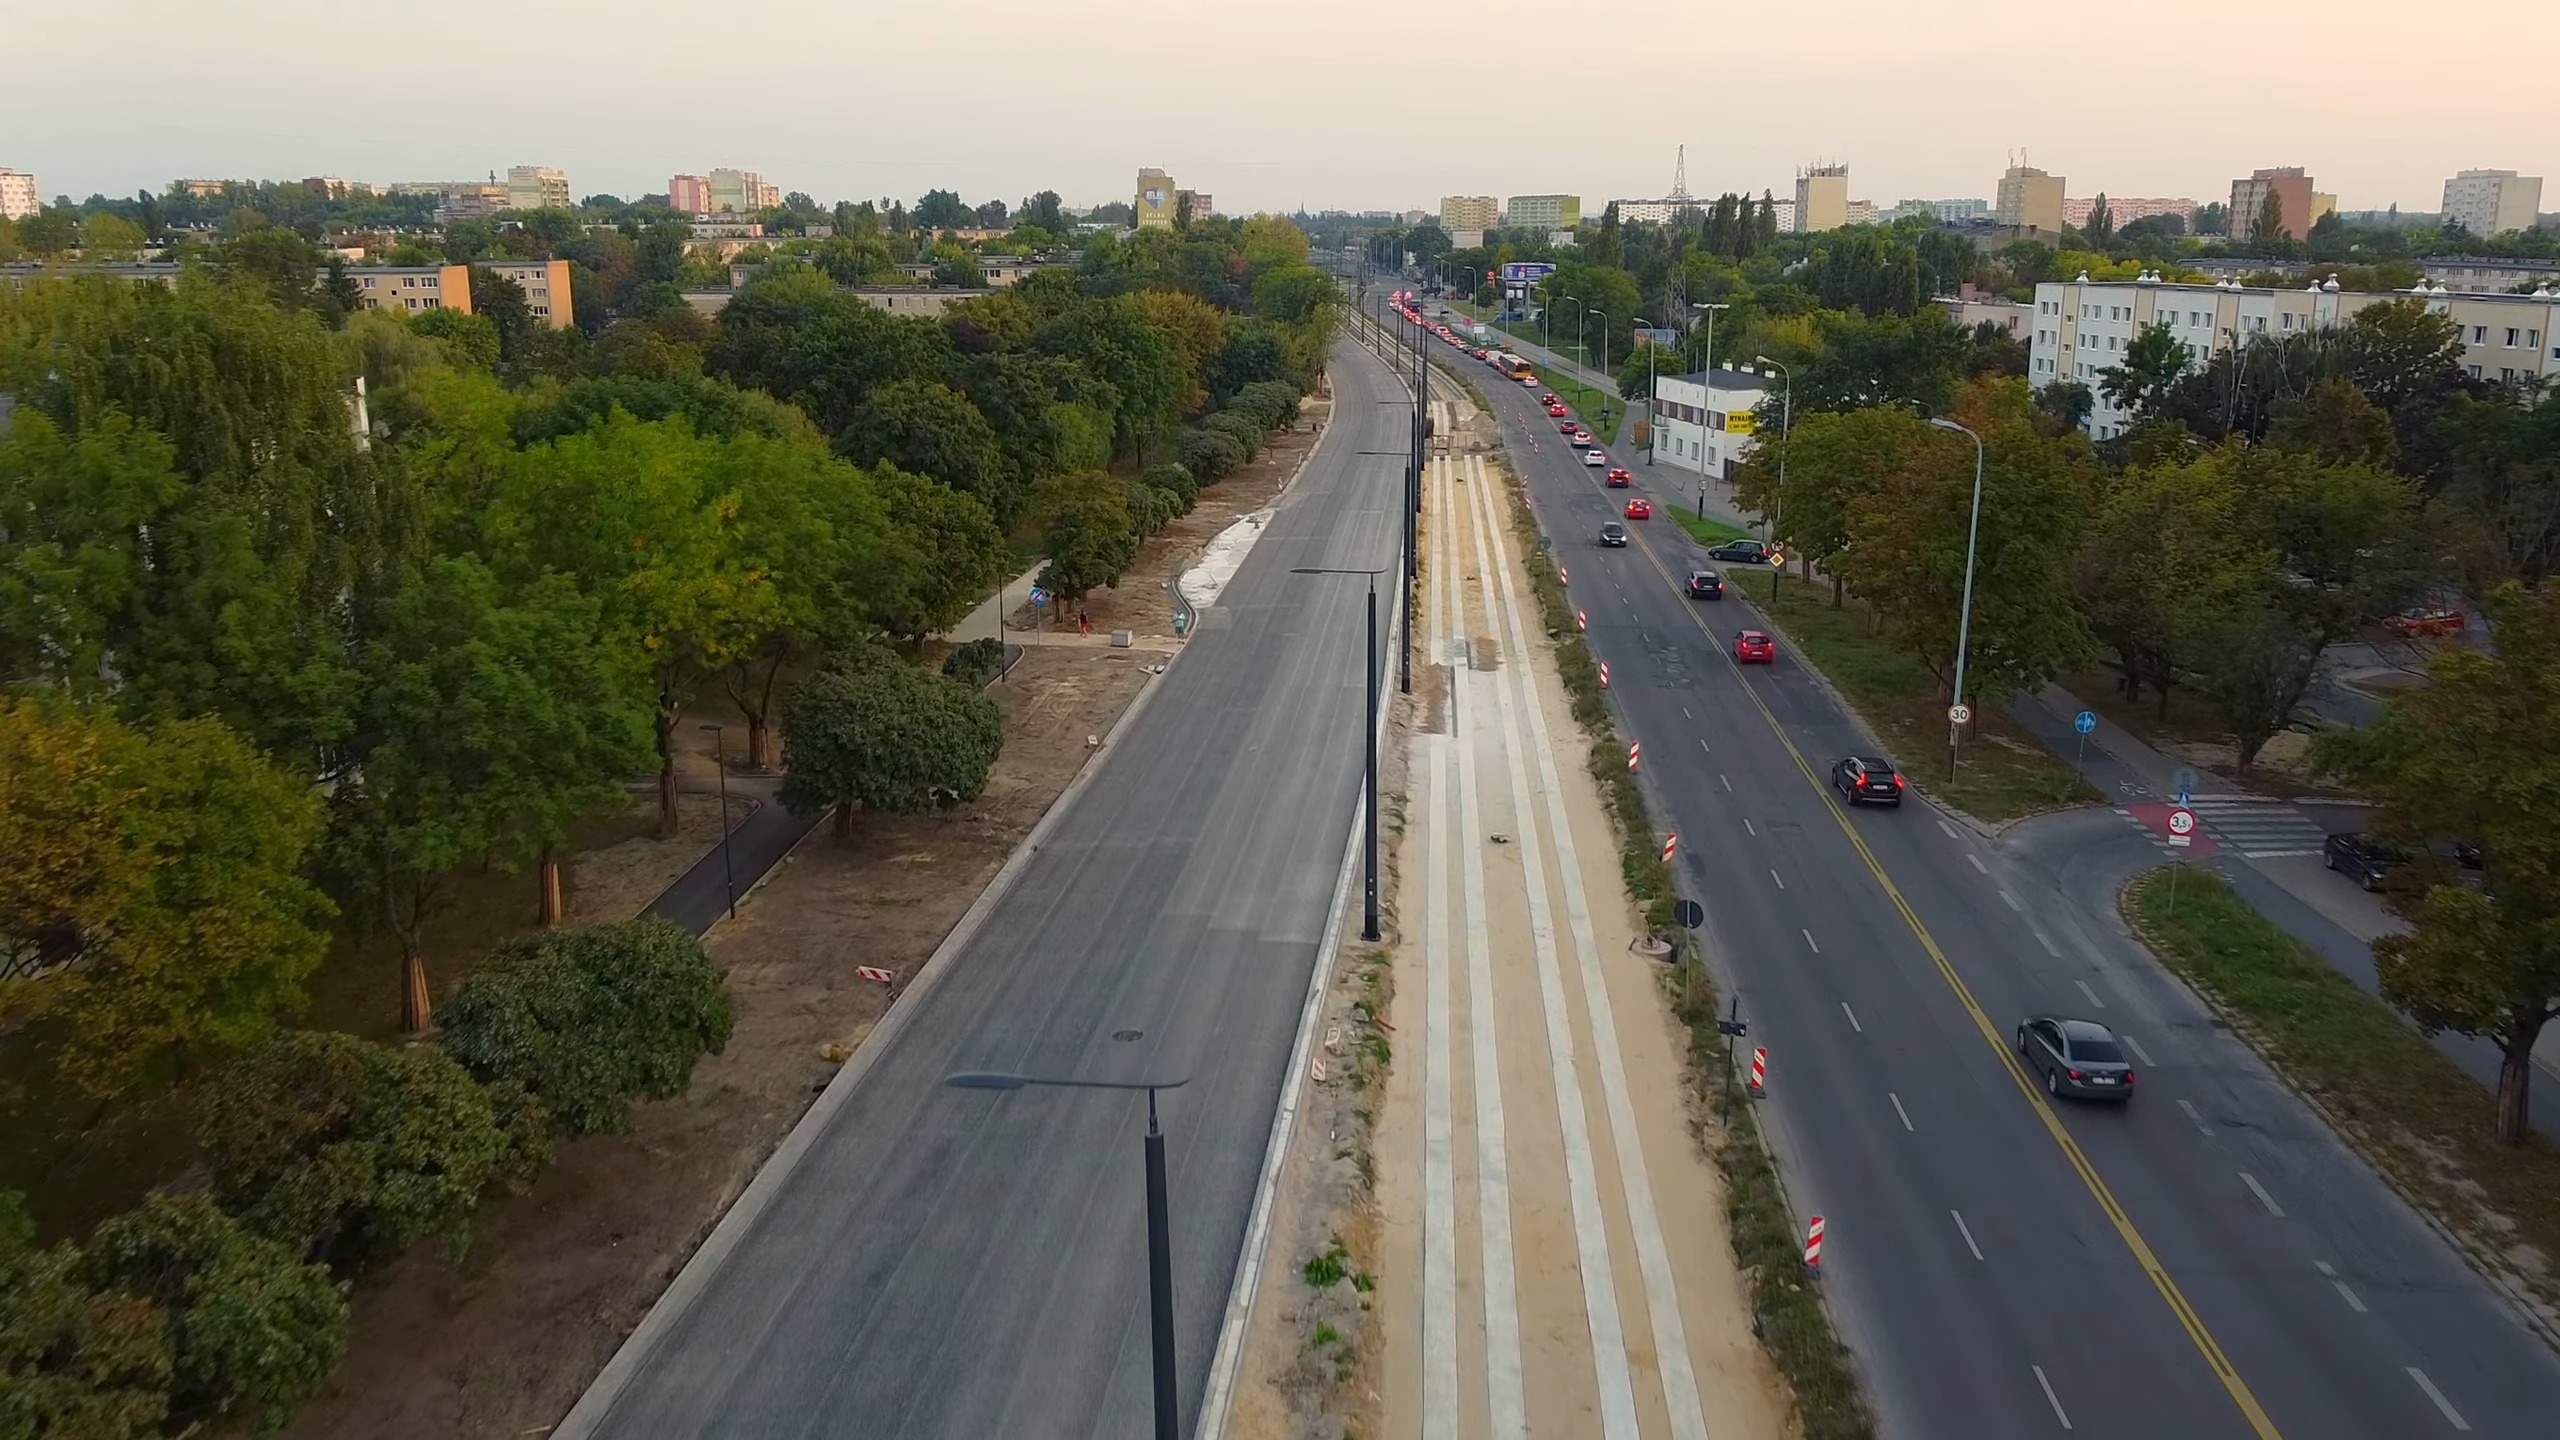
Lodz, a city known for its textile industry and unique architecture, sees an average time of 22 minutes and 20 seconds. Its central location in Poland makes it a significant transport hub.
22. Toronto, Canada ?? – 22 min 30 s
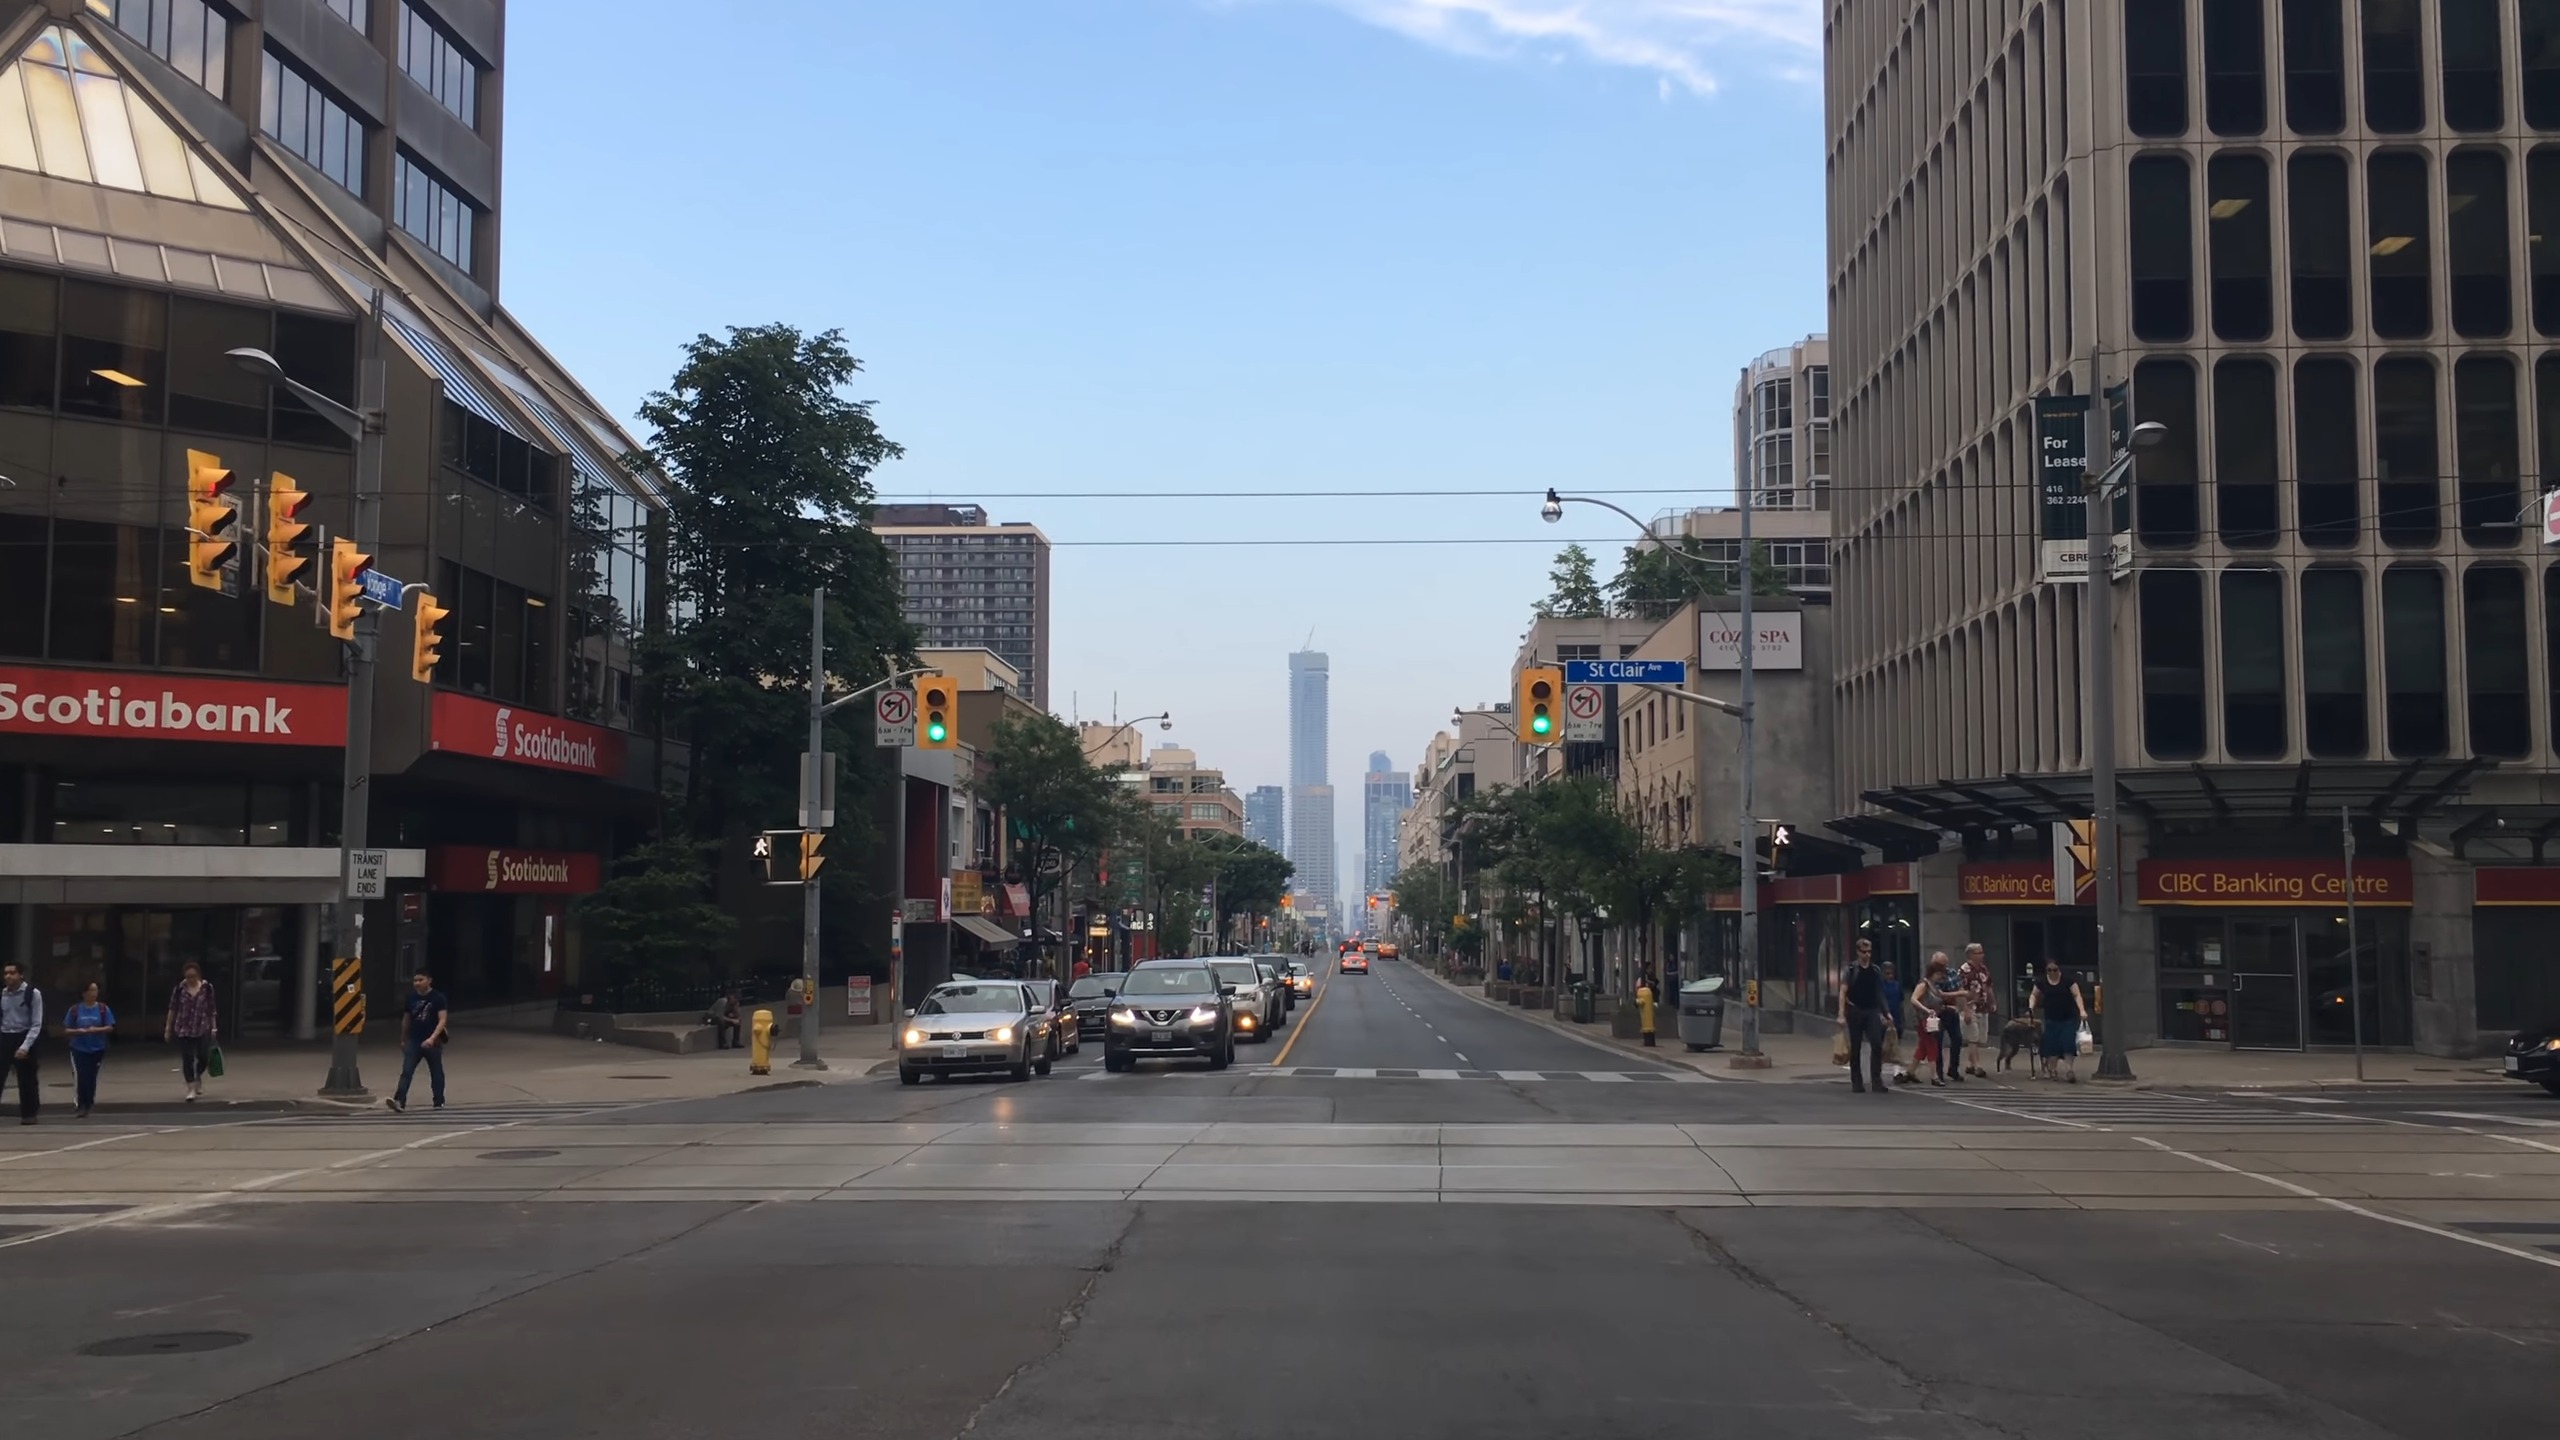
Toronto, Canada’s largest city, averages 22 minutes and 30 seconds. The city’s diverse neighborhoods and lakeshore contribute to its dynamic traffic patterns.
23. Jakarta, Indonesia ?? – 22 min 40 s
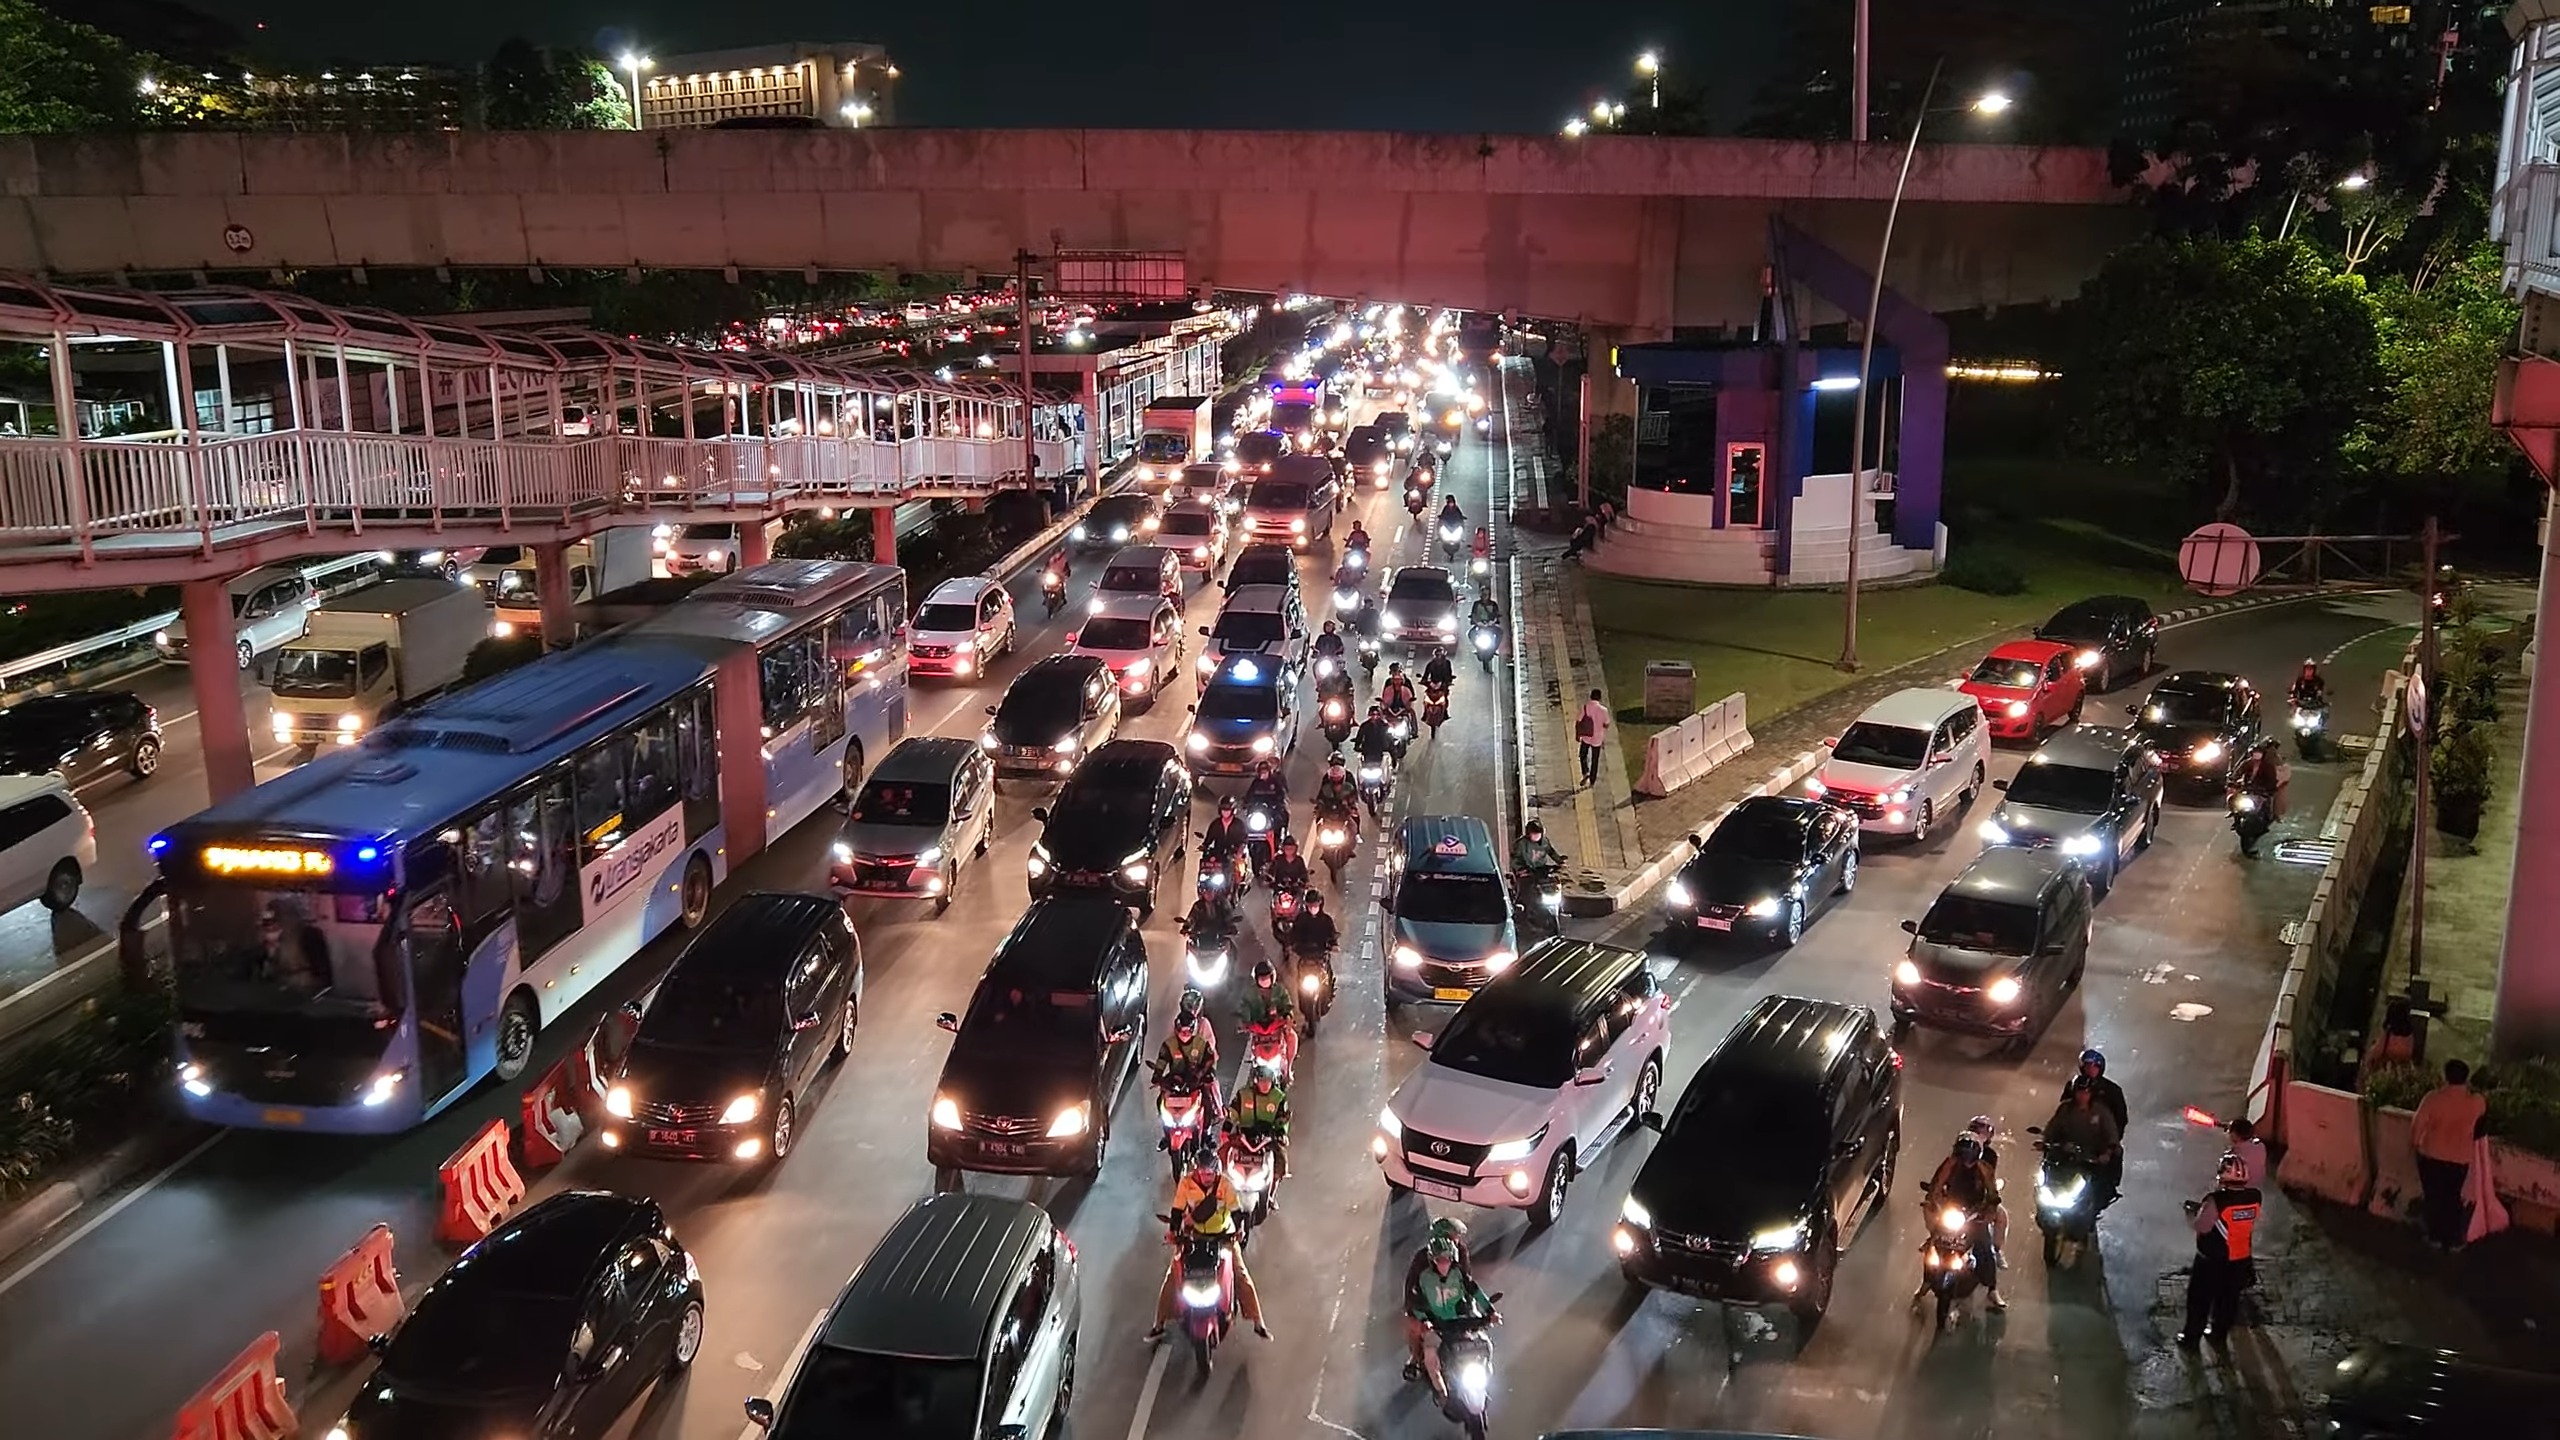
Jakarta, a city built on marshland, faces unique infrastructural challenges, resulting in an average time of 22 minutes and 40 seconds. The city’s “ojeks” or motorcycle taxis are a popular way to beat the traffic.
24. Tokyo, Japan ?? – 23 min 50 s
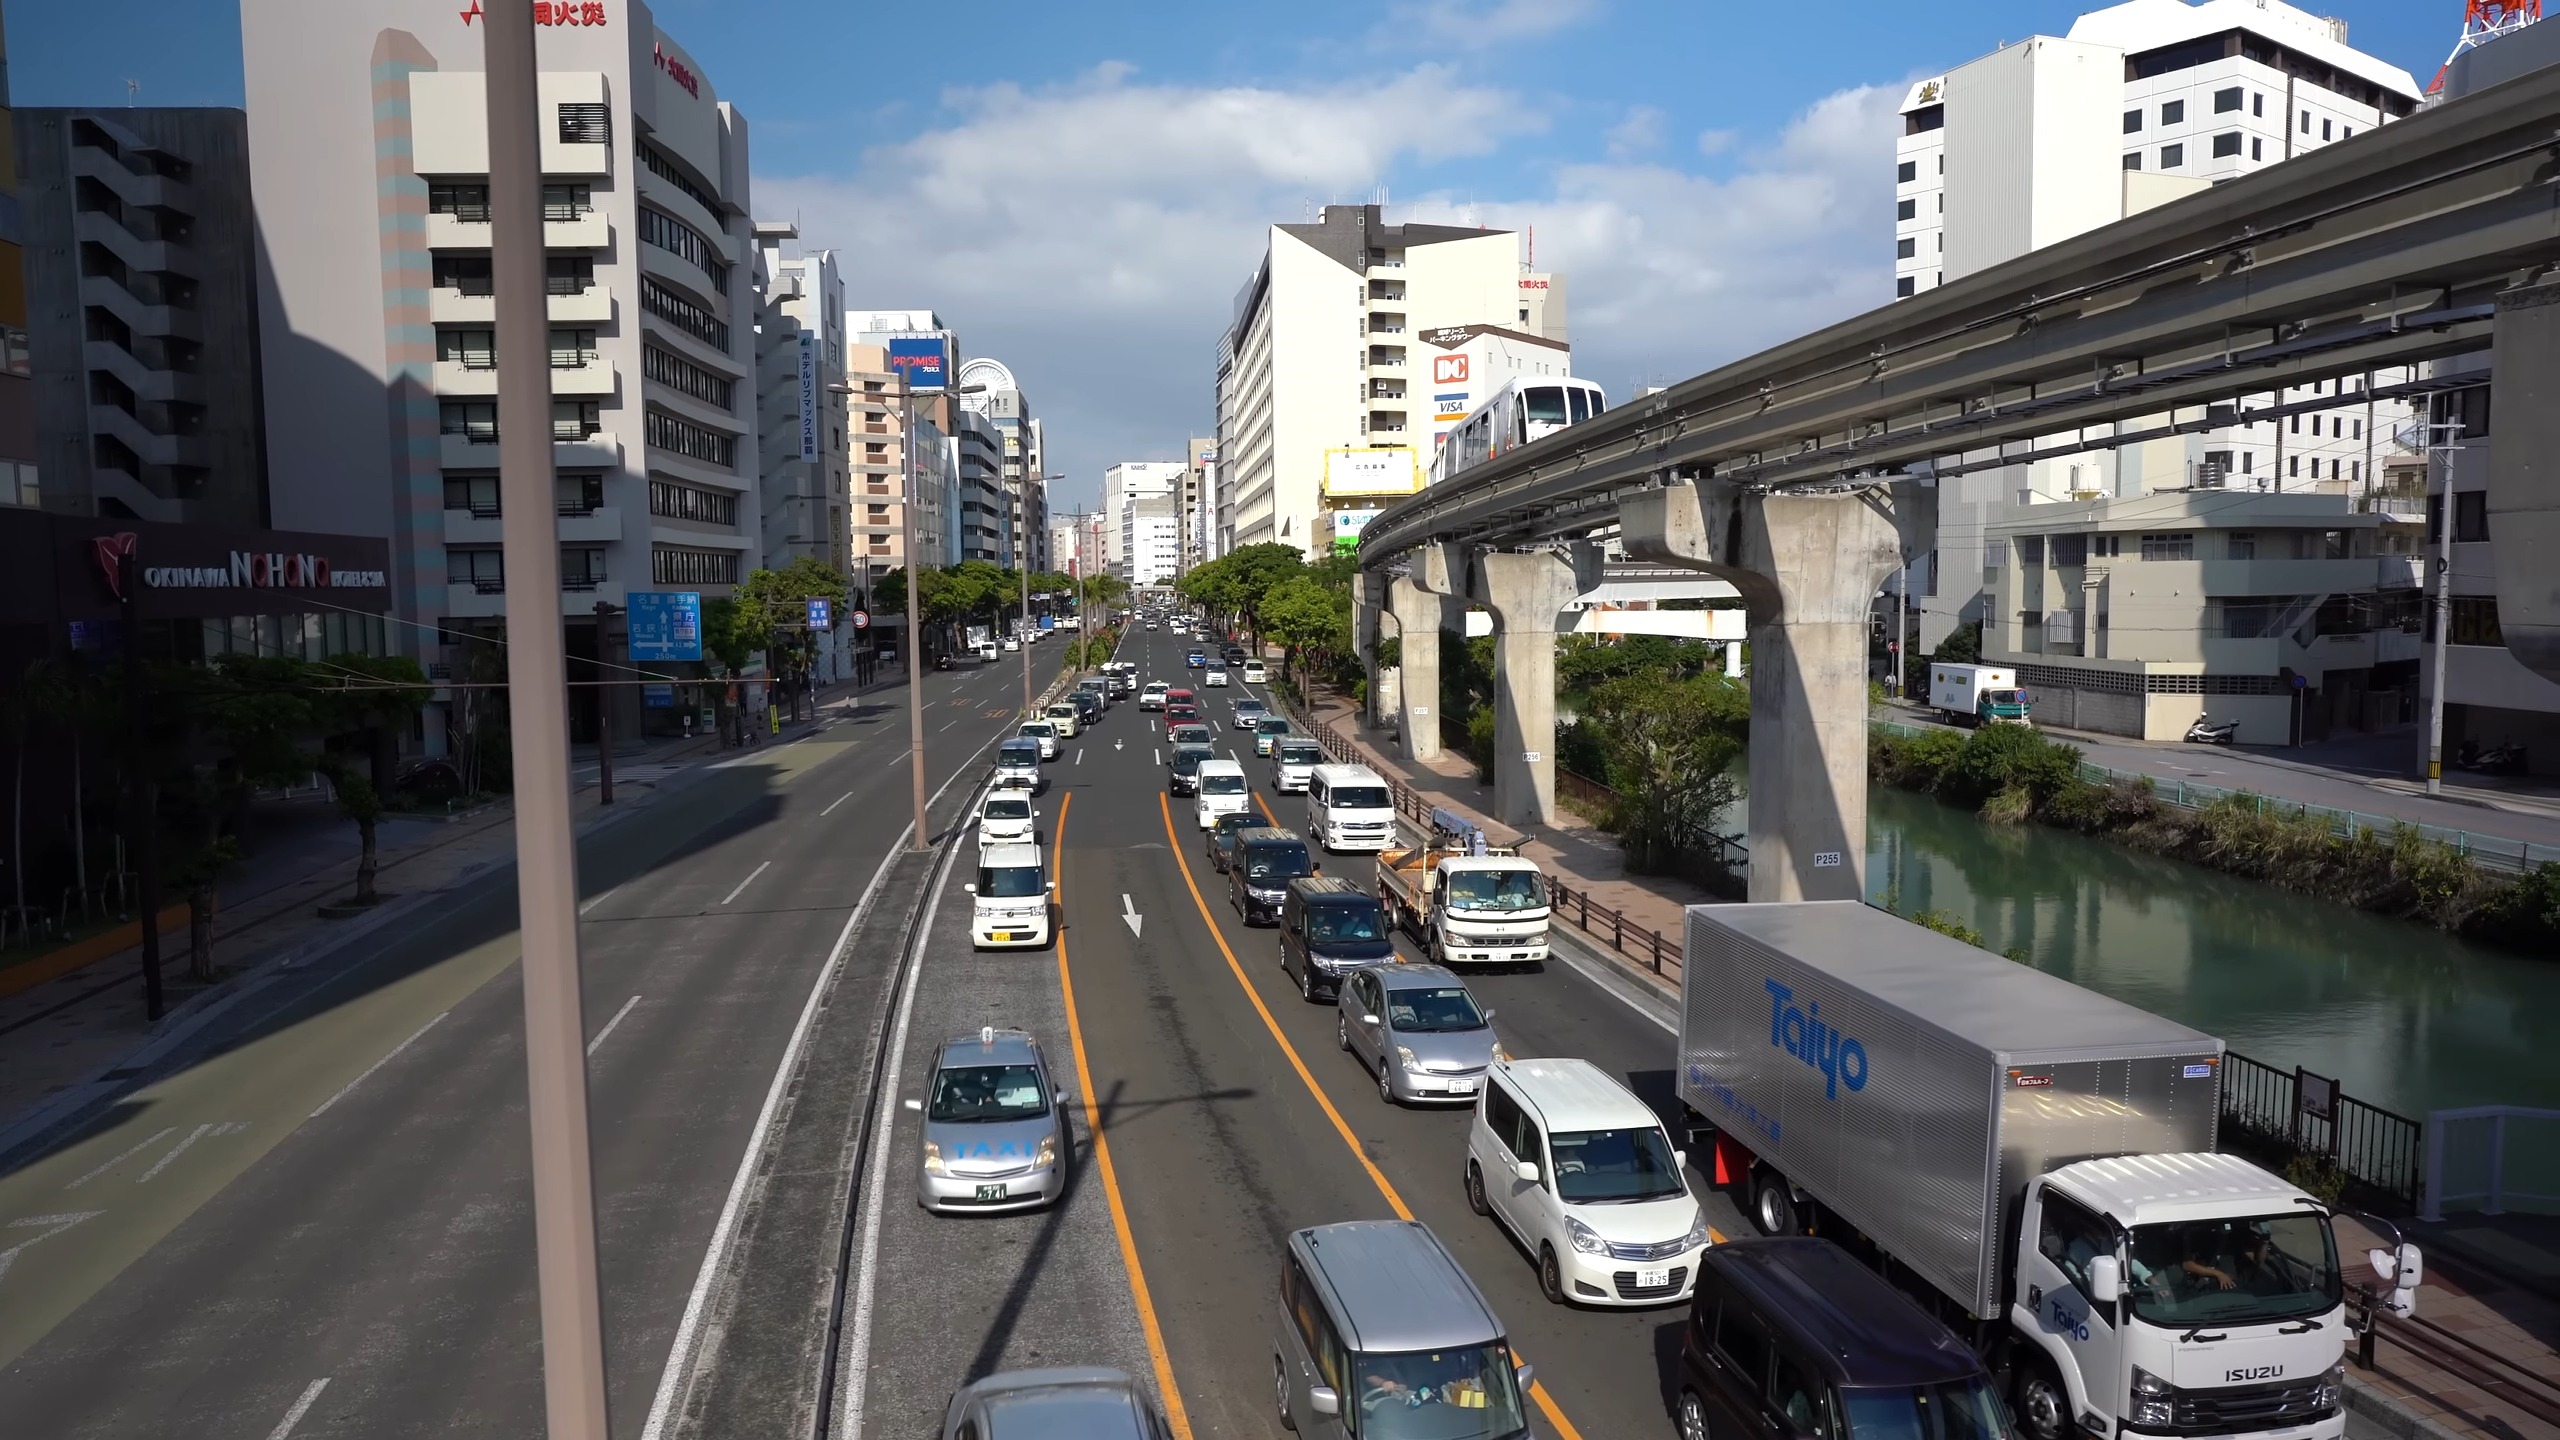
Tokyo, one of the world’s most populous cities, sees an average travel time of 23 minutes and 50 seconds. The city’s extensive metro system plays a crucial role in decongesting its streets.
25. New York, USA ?? – 24 min 30 s
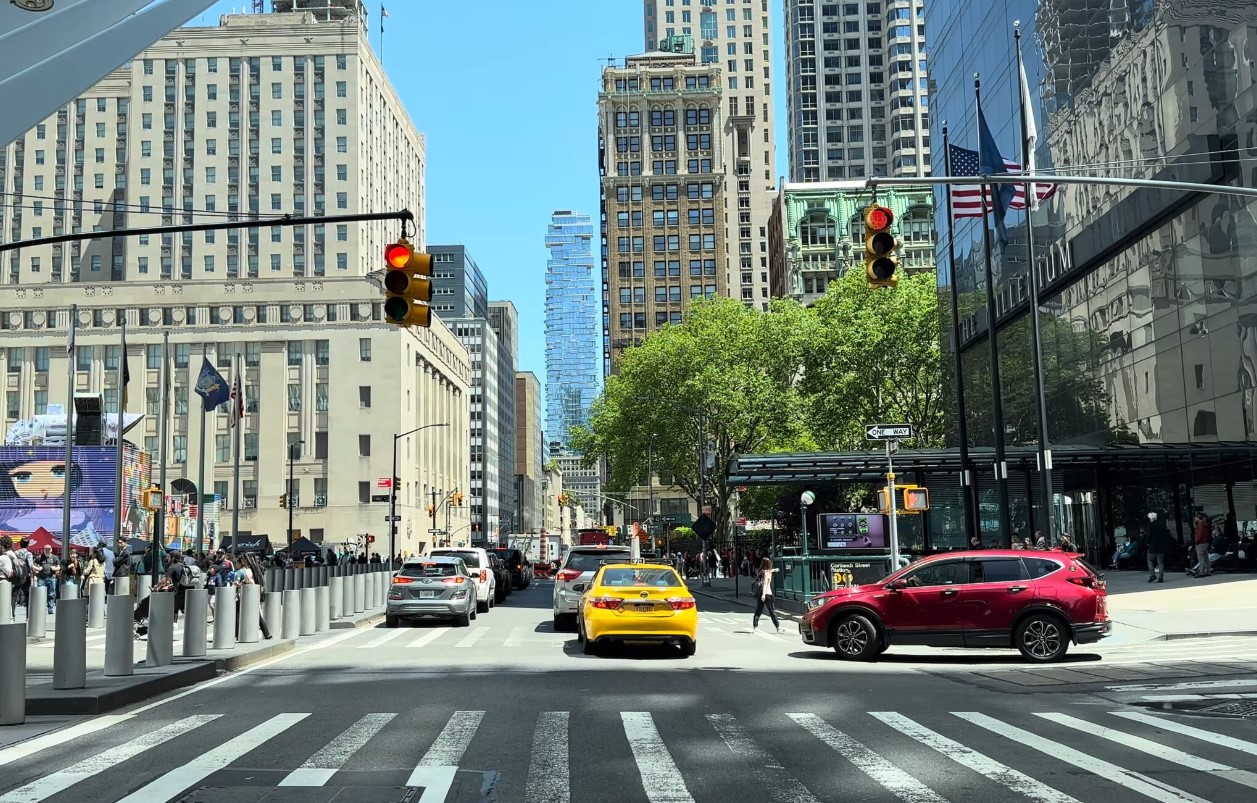
The Big Apple, with its iconic yellow cabs and bustling avenues, averages 24 minutes and 30 seconds.
26. Buenos Aires, Argentina ?? – 24 min 40 s
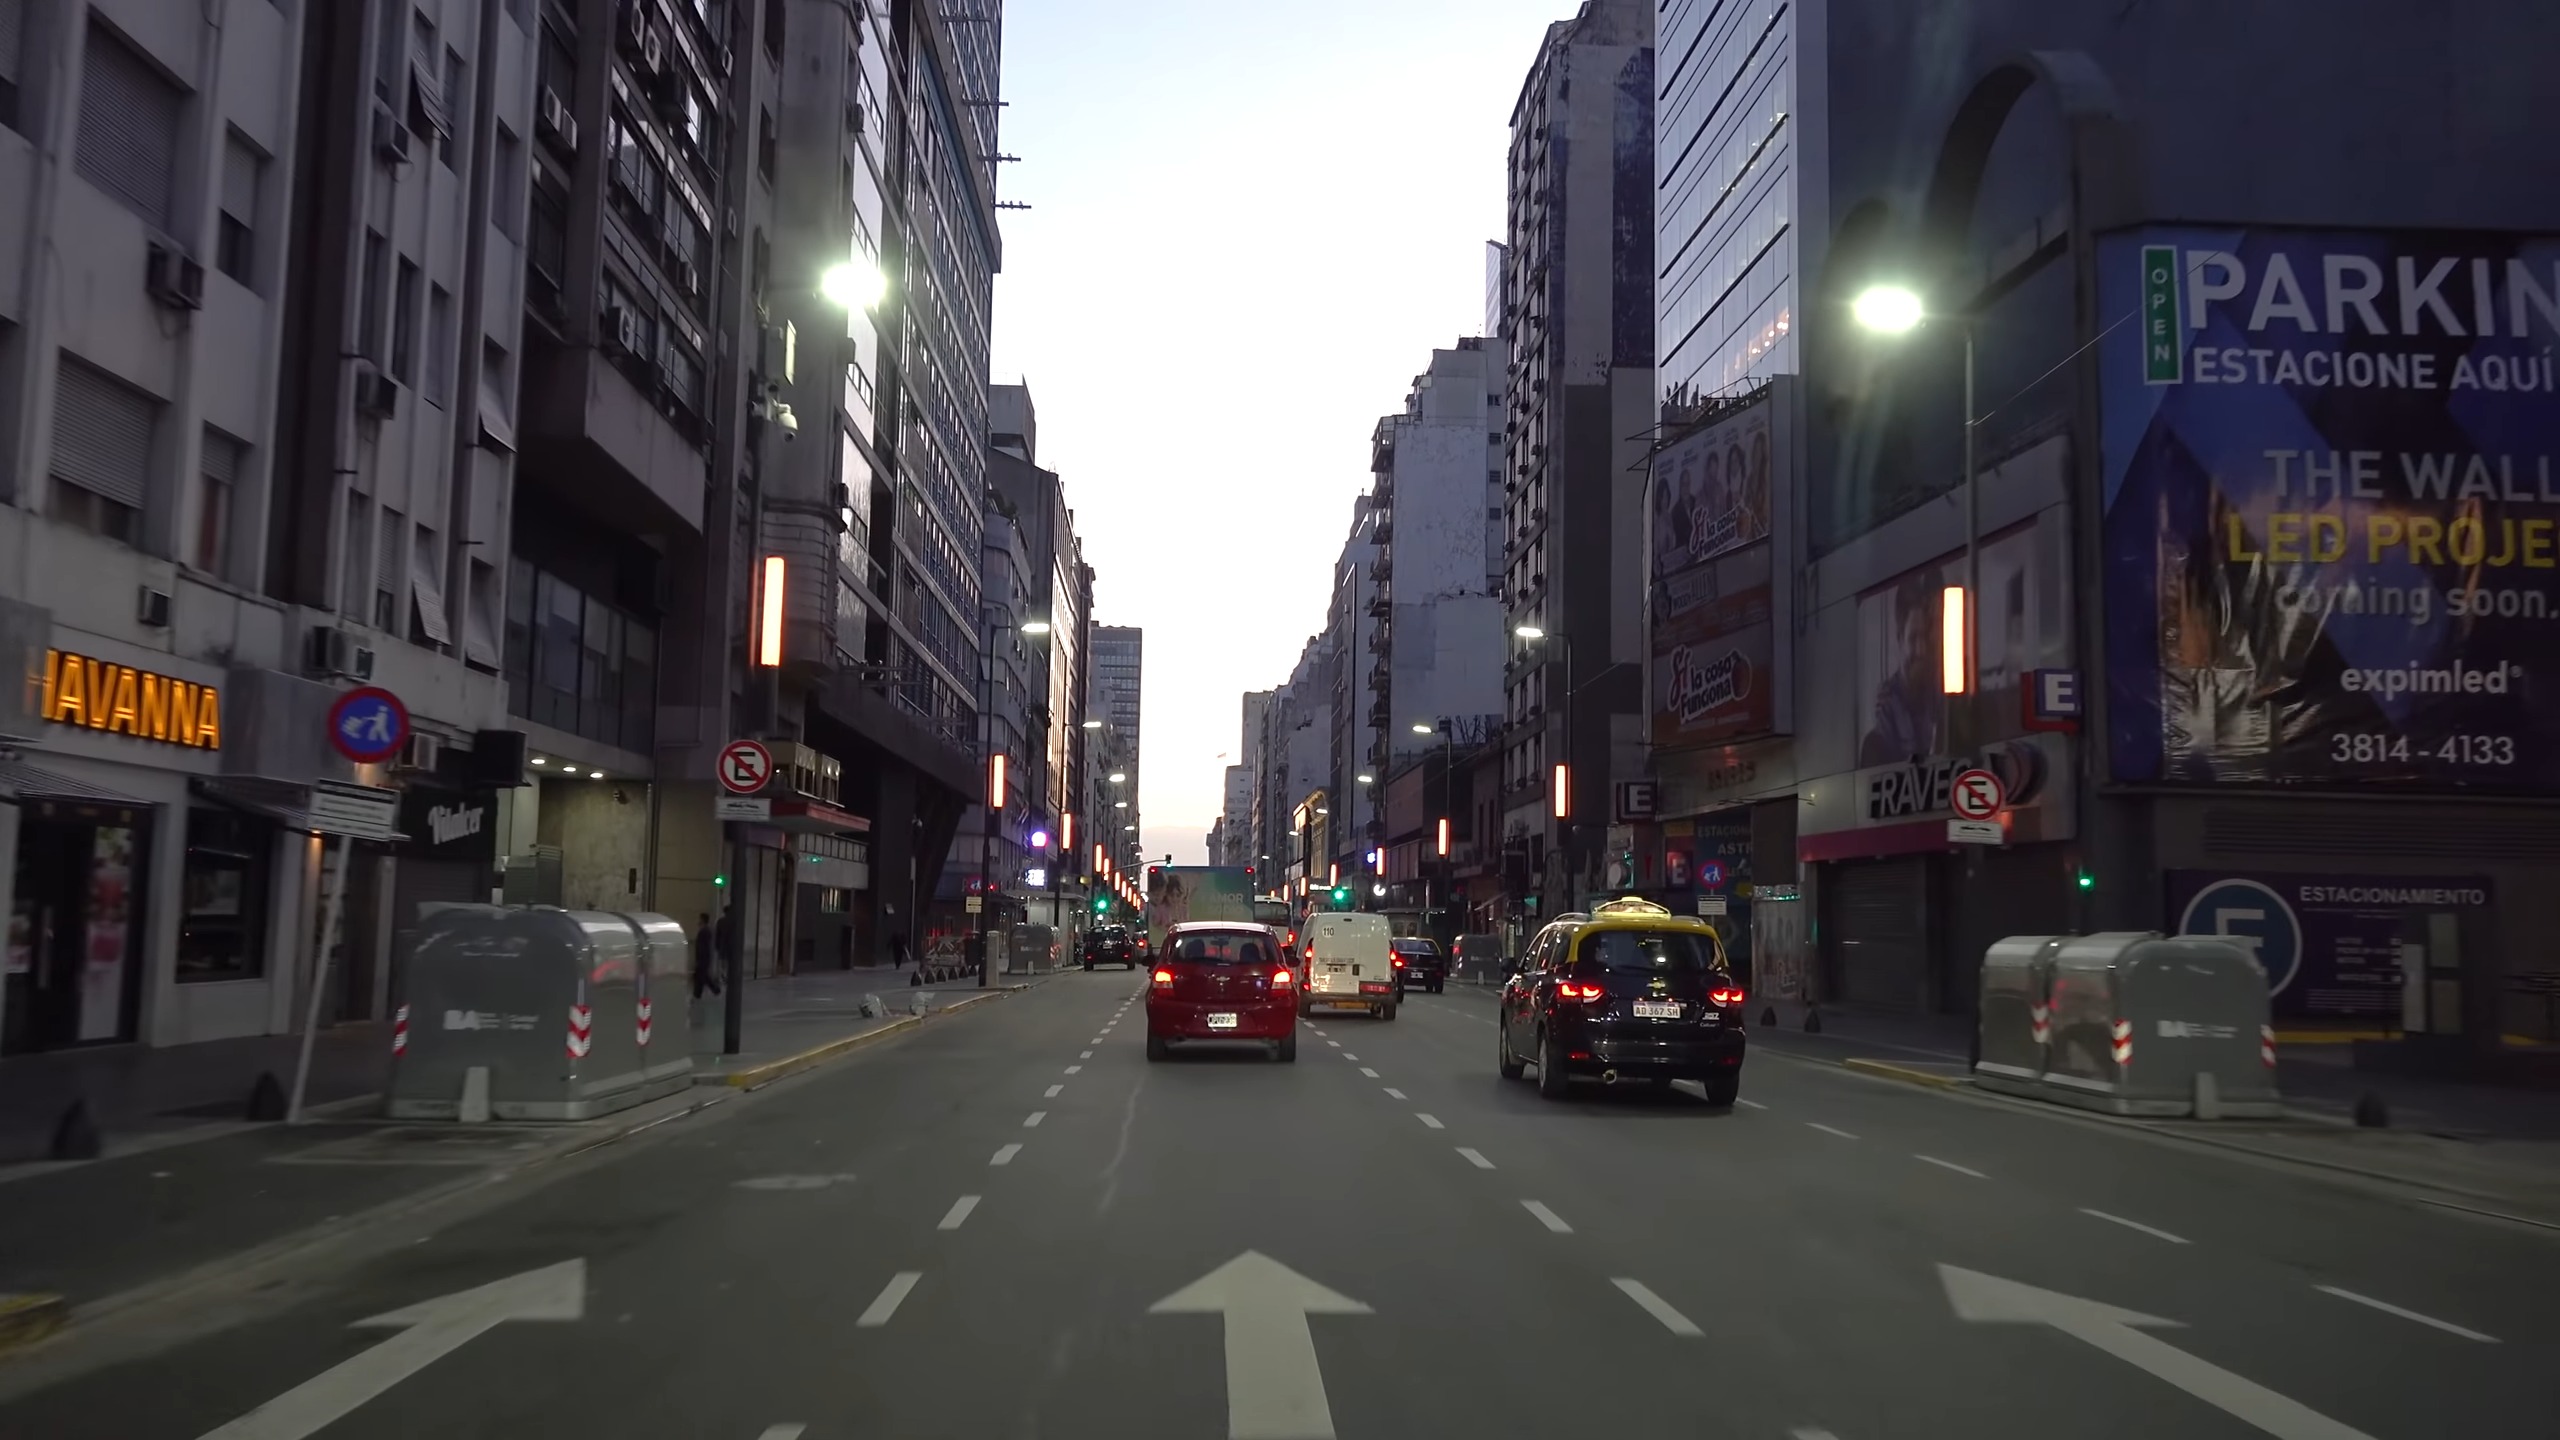
Buenos Aires, known for its tango and vibrant culture, clocks in at 24 minutes and 40 seconds. The city’s broad avenues, inspired by European design, are both a blessing and a curse when it comes to traffic.
27. Brussels, Belgium ?? – 25 min 30 s
Brussels, the heart of Europe, sees an average time of 25 minutes and 30 seconds. The city’s numerous roundabouts and historic centers contribute to its traffic patterns.
28. Mexico City, Mexico ?? – 25 min 40 s
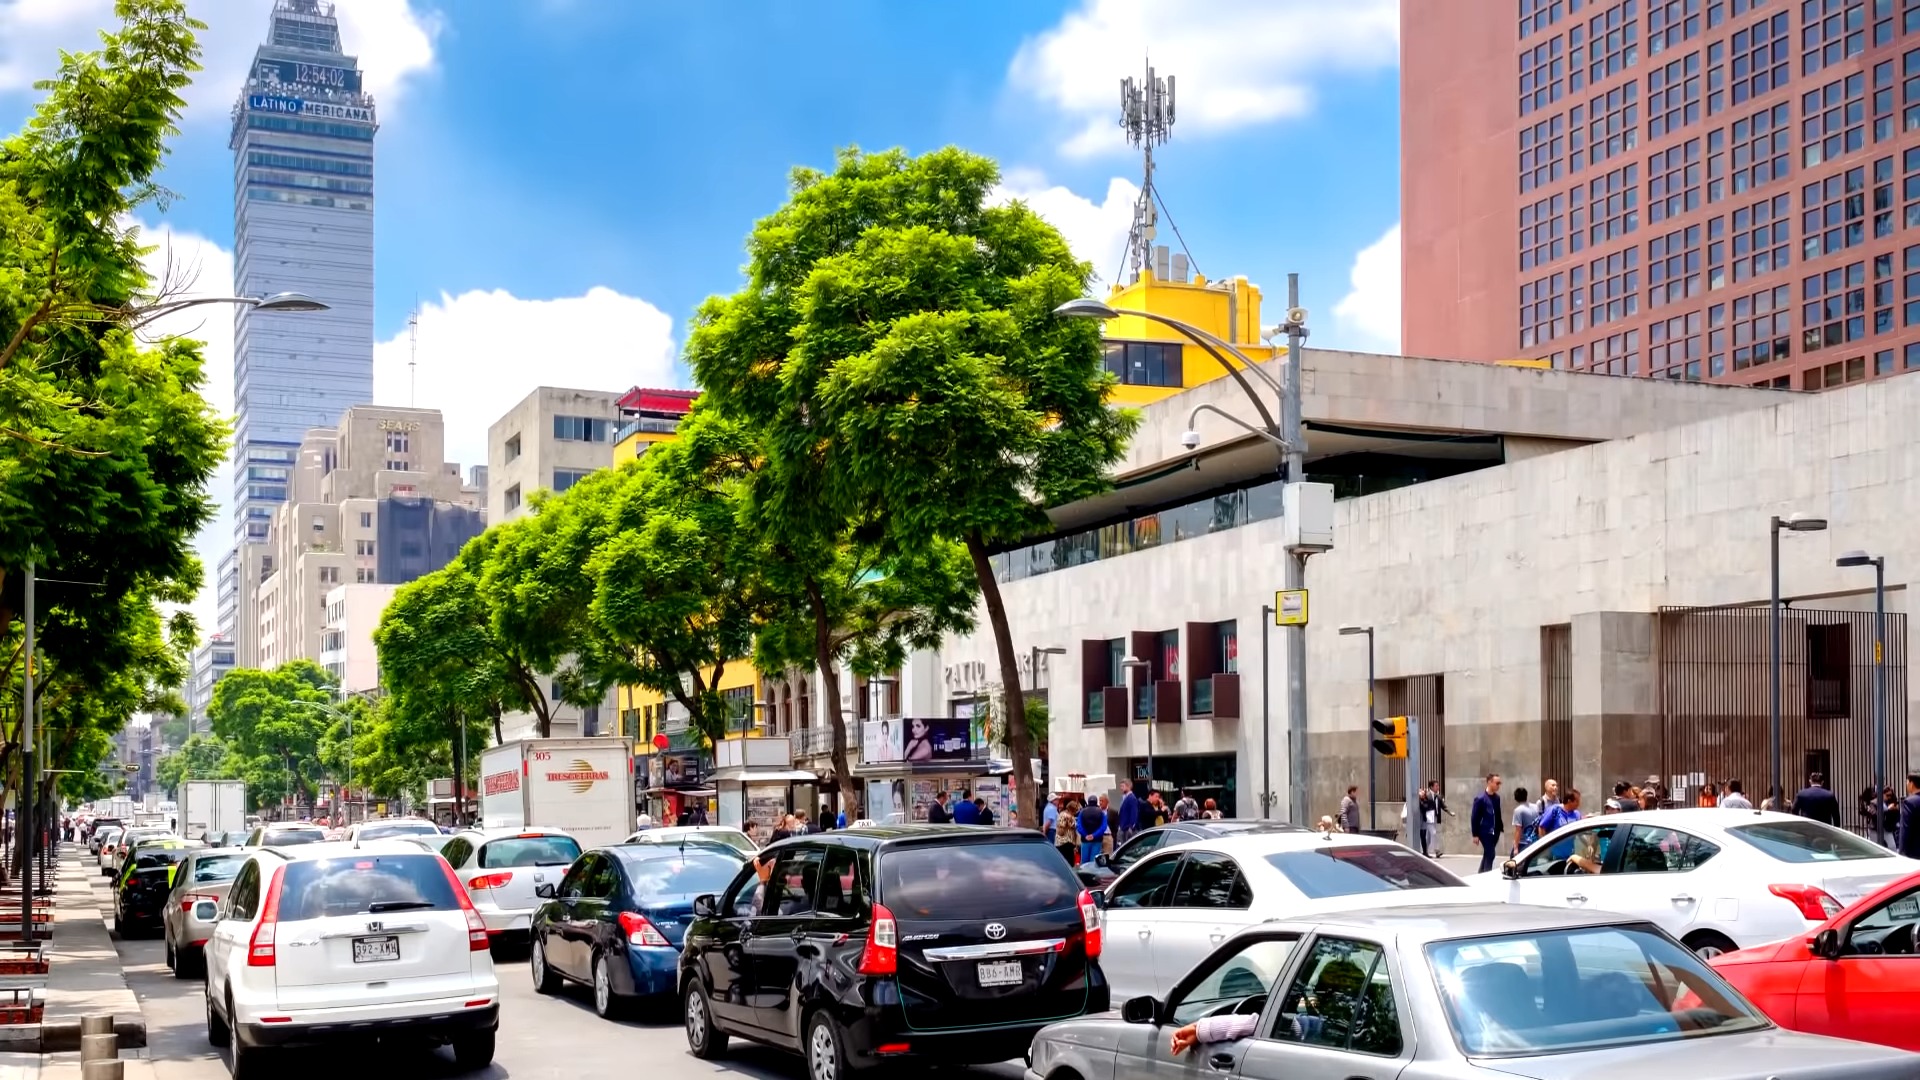
Tied with Rome, Mexico City’s vast expanse and high-altitude location make for an average travel time of 25 minutes and 40 seconds. The city’s “paseo” tradition, where residents take to the streets in the evenings, adds to its traffic dynamics.
29. Rome, Italy ?? – 25 min 40 s
Rome, the eternal city, matches Mexico City’s time. Navigating around ancient ruins and narrow alleys is a daily reality for its residents.
30. Paris, France ?? – 26 min 10 s
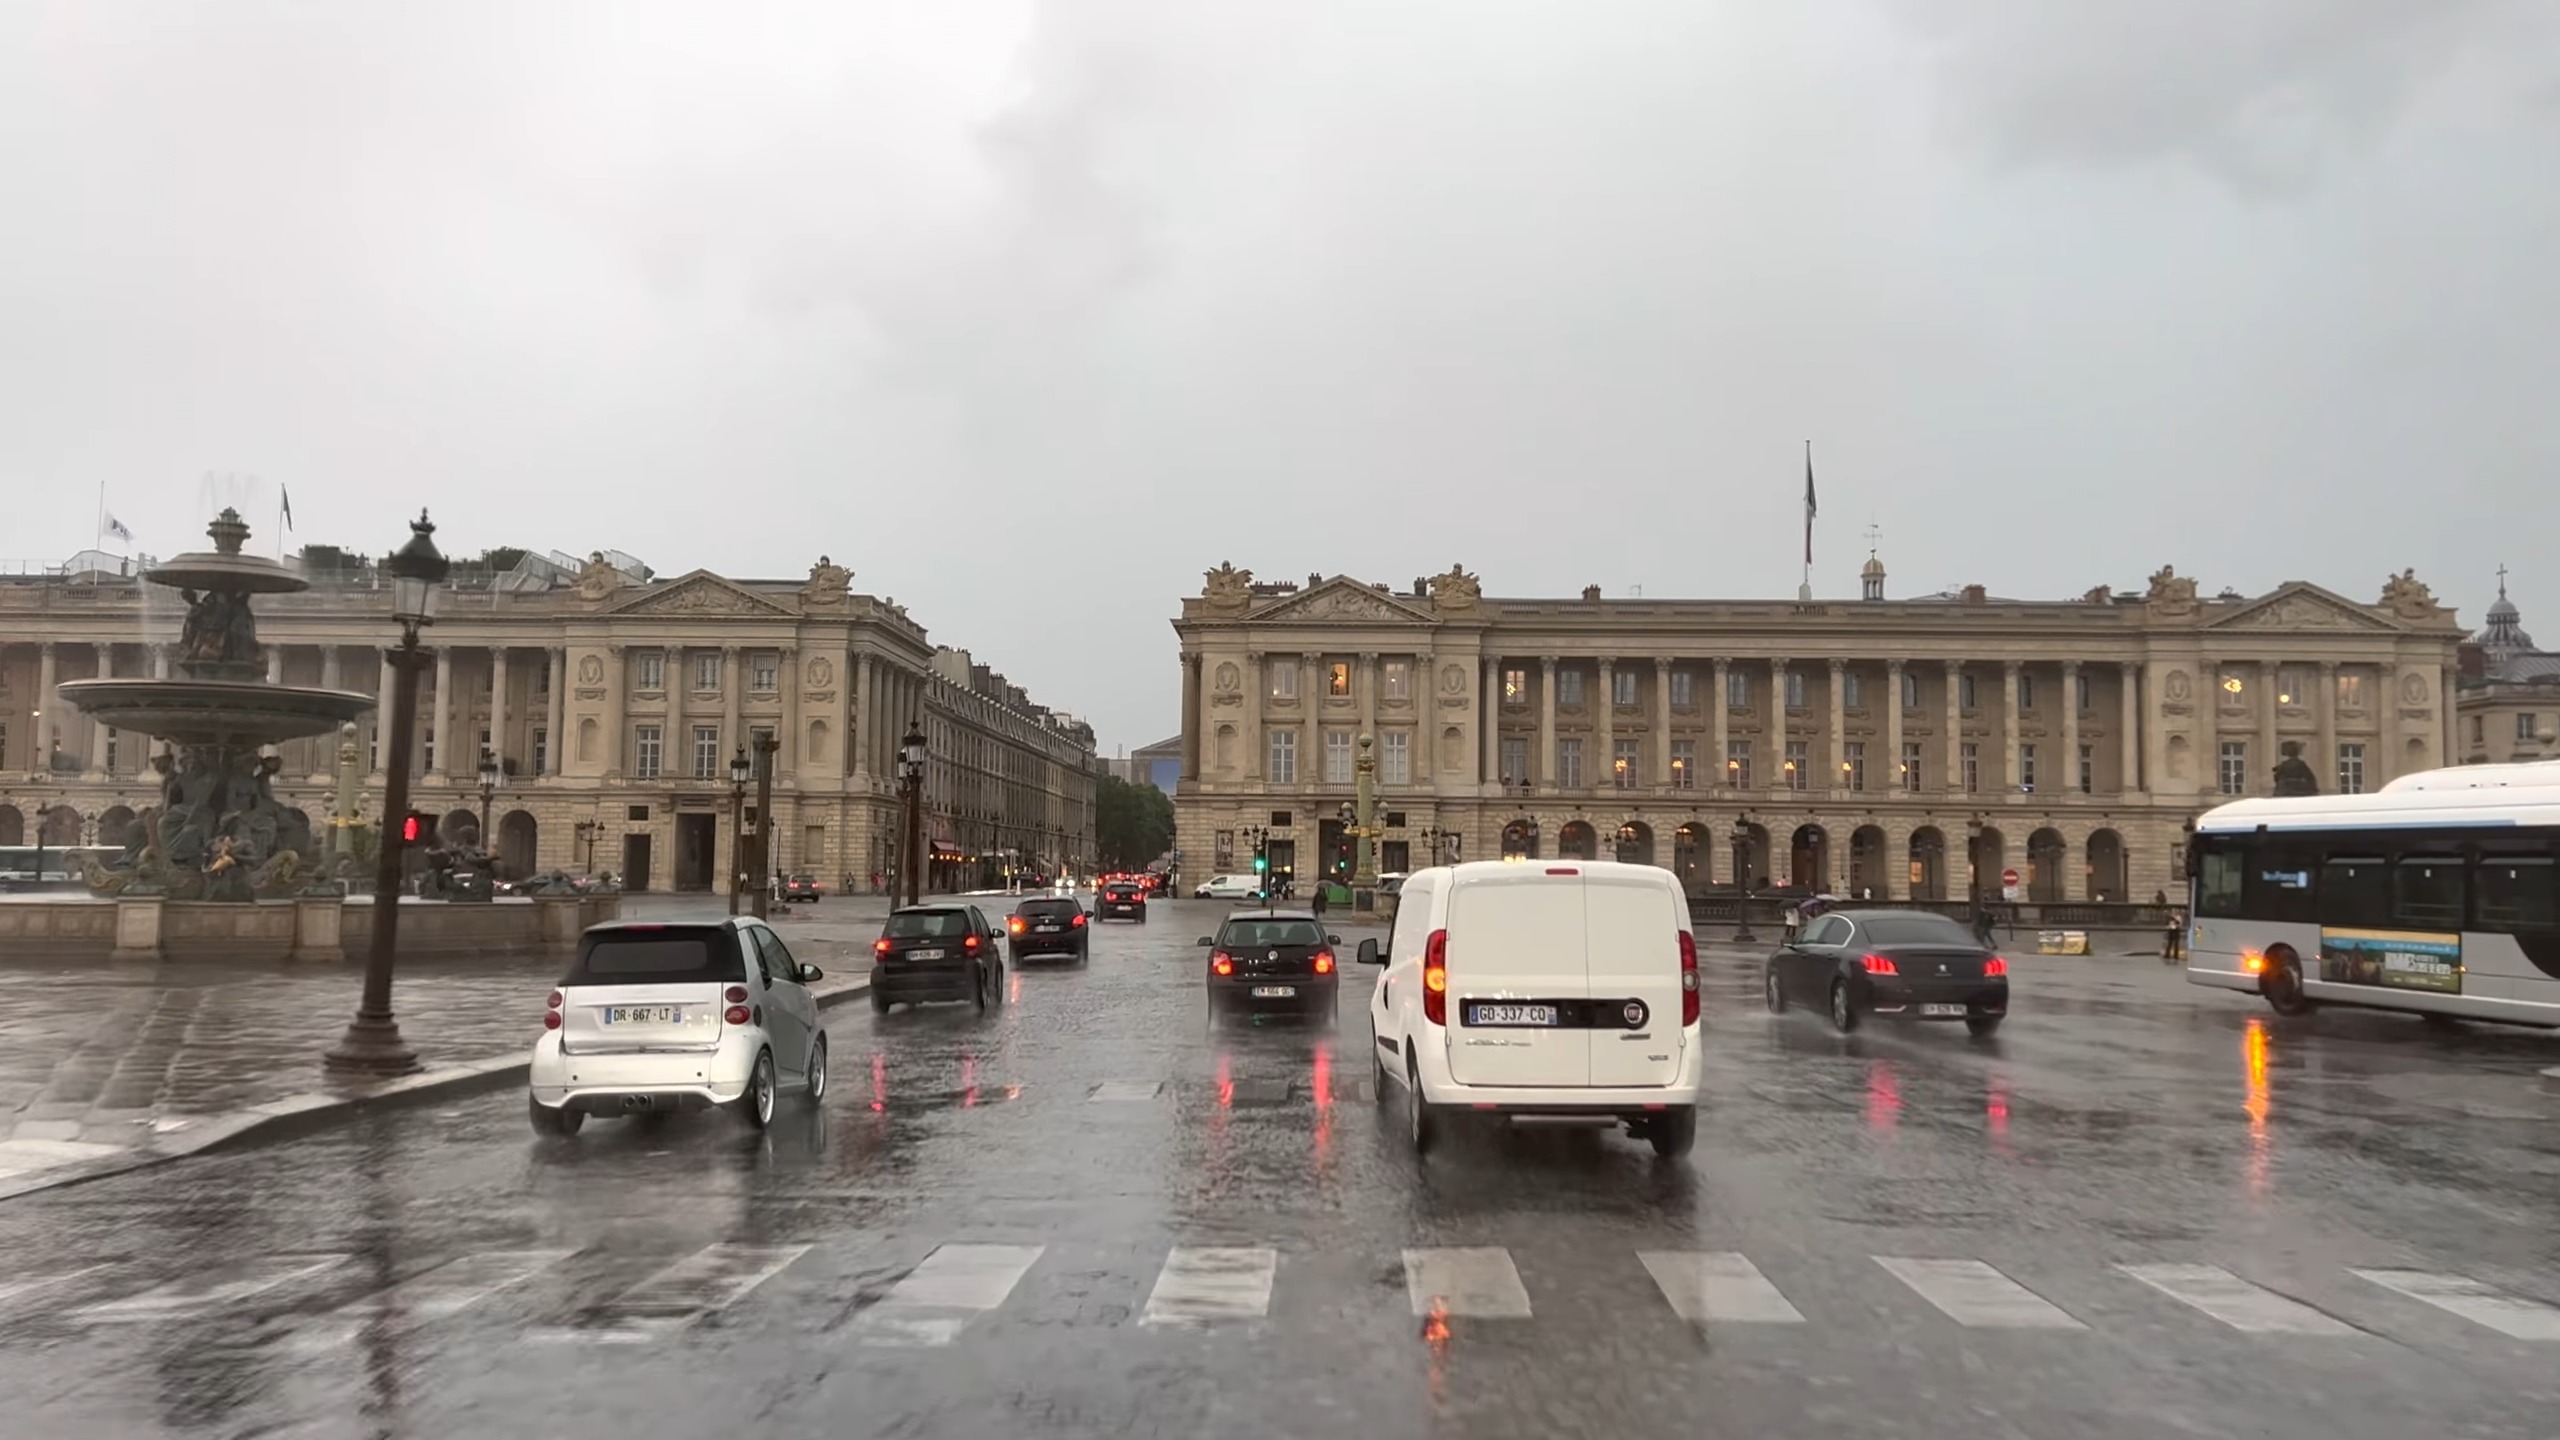
Paris, the city of love, averages 26 minutes and 10 seconds. The city’s historic boulevards and riverside drives, while scenic, contribute to its traffic.
31. Bogota, Colombia ?? – 26 min 20 s
Bogota, with its mountainous backdrop, sees an average time of 26 minutes and 20 seconds. The city’s “ciclovía” tradition, where main roads are closed off for cyclists on Sundays, is a unique approach to traffic management.
32. Manila, Philippines ?? – 27 min 00 s
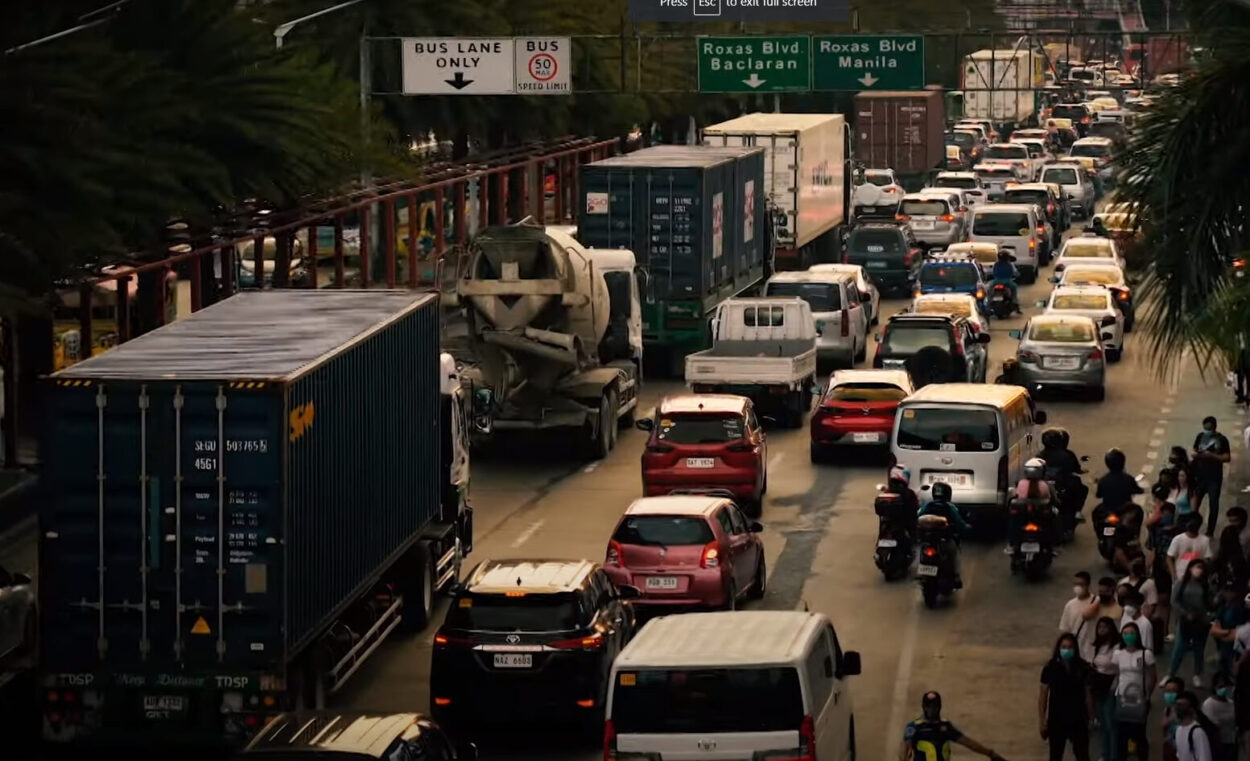
Manila, an archipelagic megacity, averages 27 minutes. The city’s “jeepneys,” a popular mode of transport, add color and character to its streets.
33. Lima, Peru ?? – 27 min 10 s
Lima, overlooking the Pacific, clocks in at 27 minutes and 10 seconds. The city’s coastal location and colonial history present unique traffic challenges.
34. Bucharest, Romania ?? – 27 min 20 s
Tied with Pune, Bucharest’s wide boulevards, a legacy of its communist past, result in an average time of 27 minutes and 20 seconds.
35. Pune, India ?? – 27 min 20 s
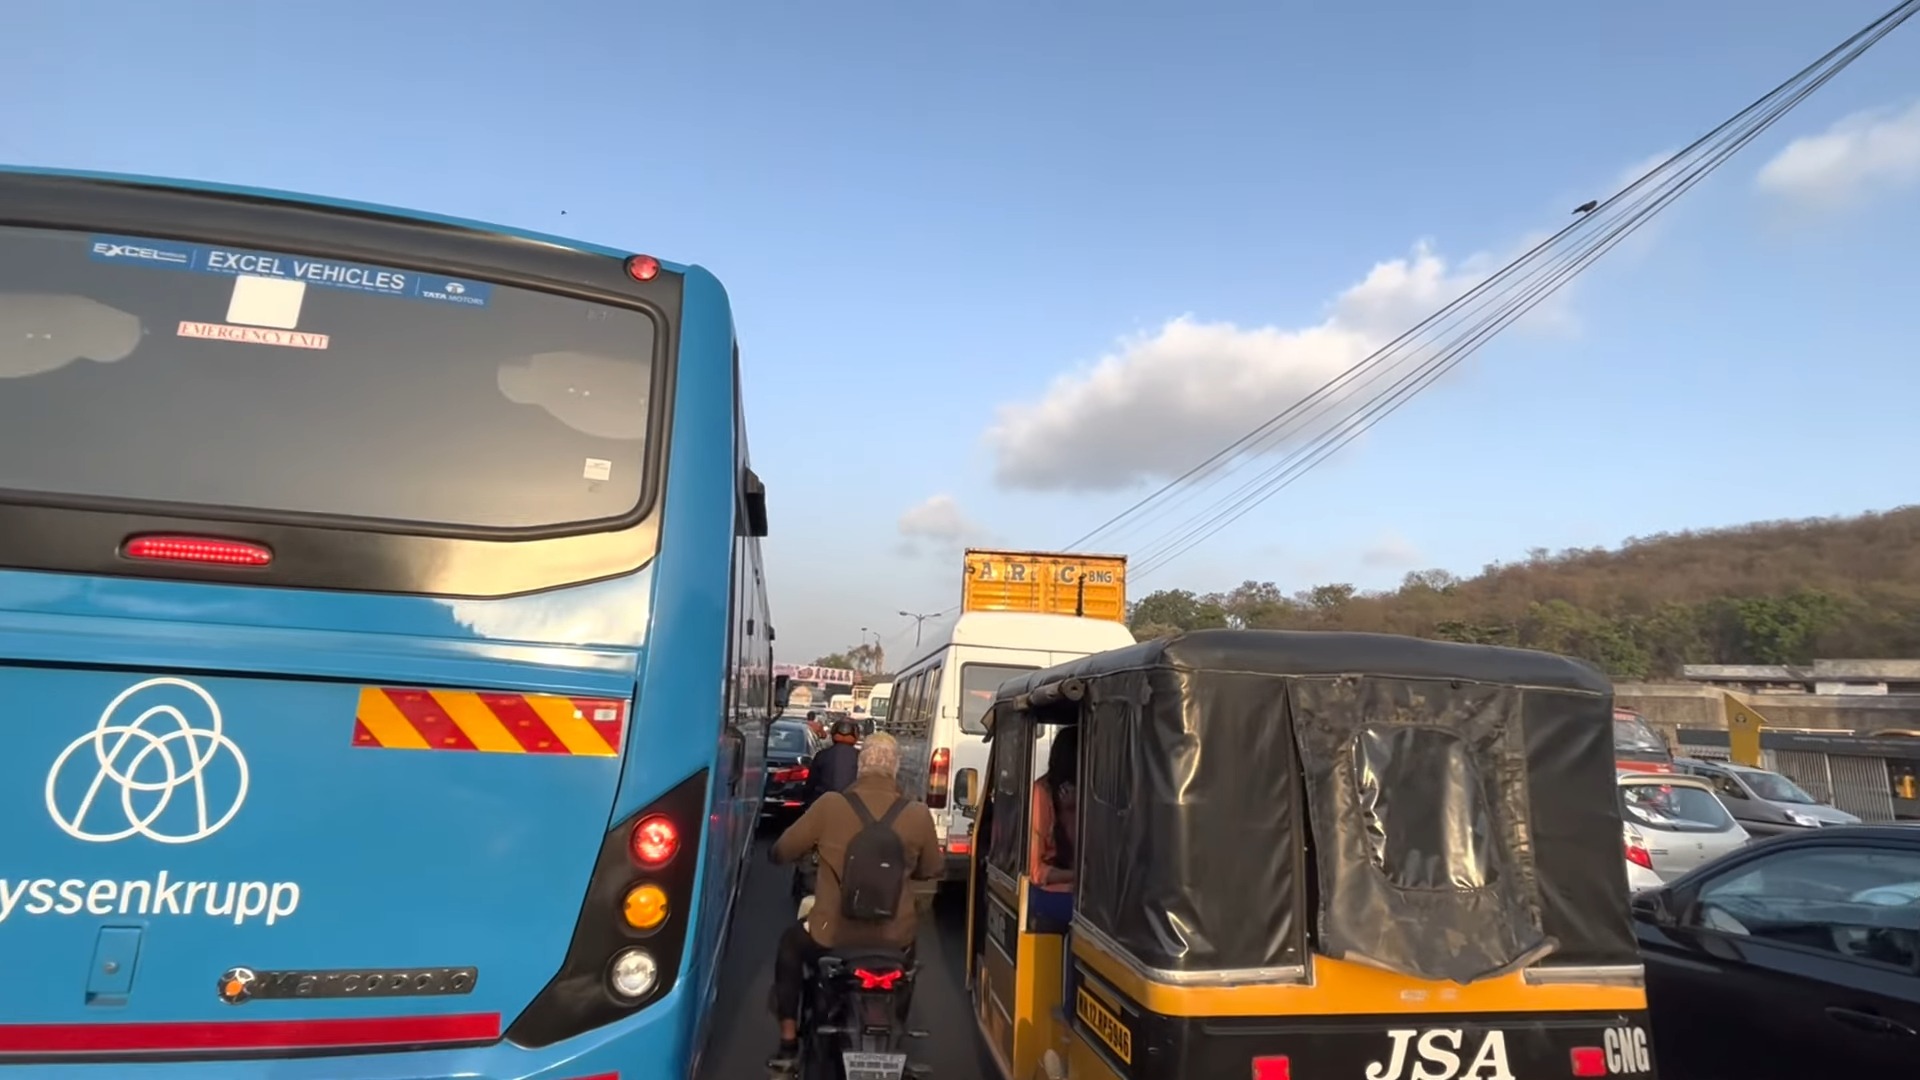
Pune, a growing IT hub, matches Bucharest’s time. The city’s mix of old and new presents both challenges and opportunities for traffic management.
36. Milan, Italy ?? – 27 min 30 s
Milan, a global fashion capital, sees an average travel time of 27 minutes and 30 seconds. The city’s numerous events and shows often lead to traffic spikes.
37. Sapporo, Japan ?? – 27 min 40 s
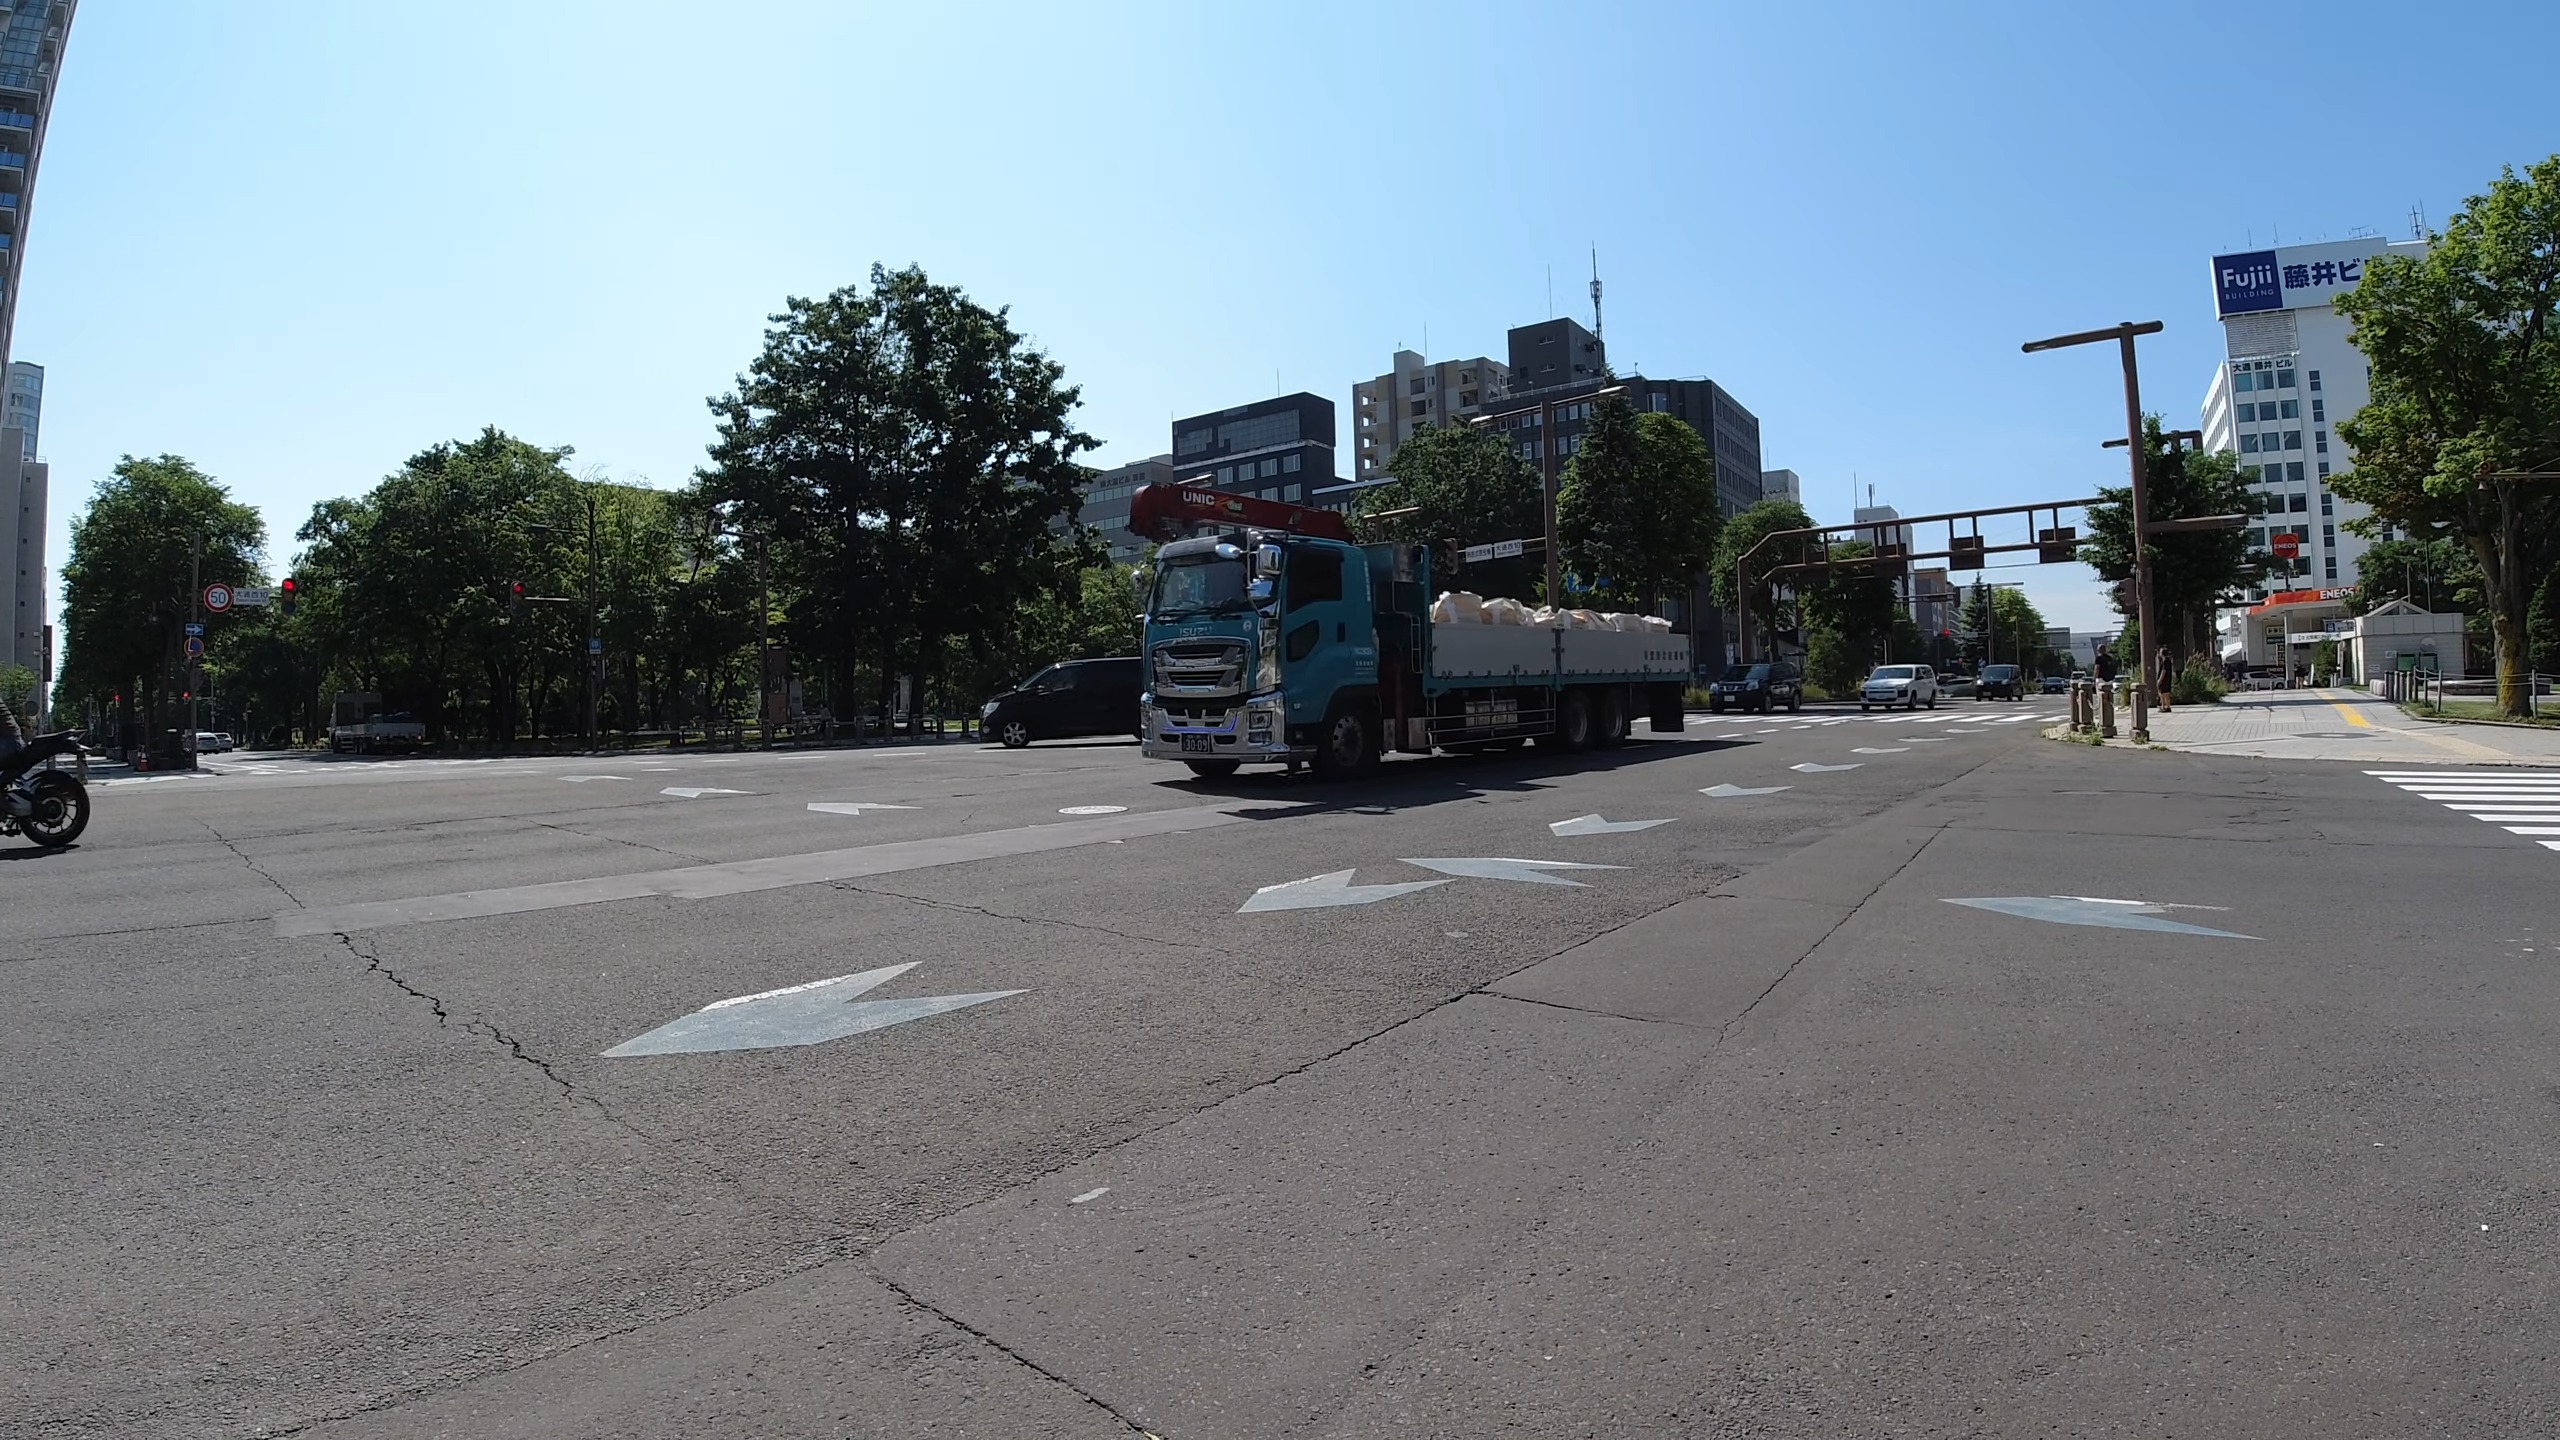
Sapporo, famous for its snow festivals, clocks in at 27 minutes and 40 seconds. The city’s grid system, designed after the American model, plays a role in its traffic patterns.
38. Dublin, Ireland ?? – 28 min 30 s
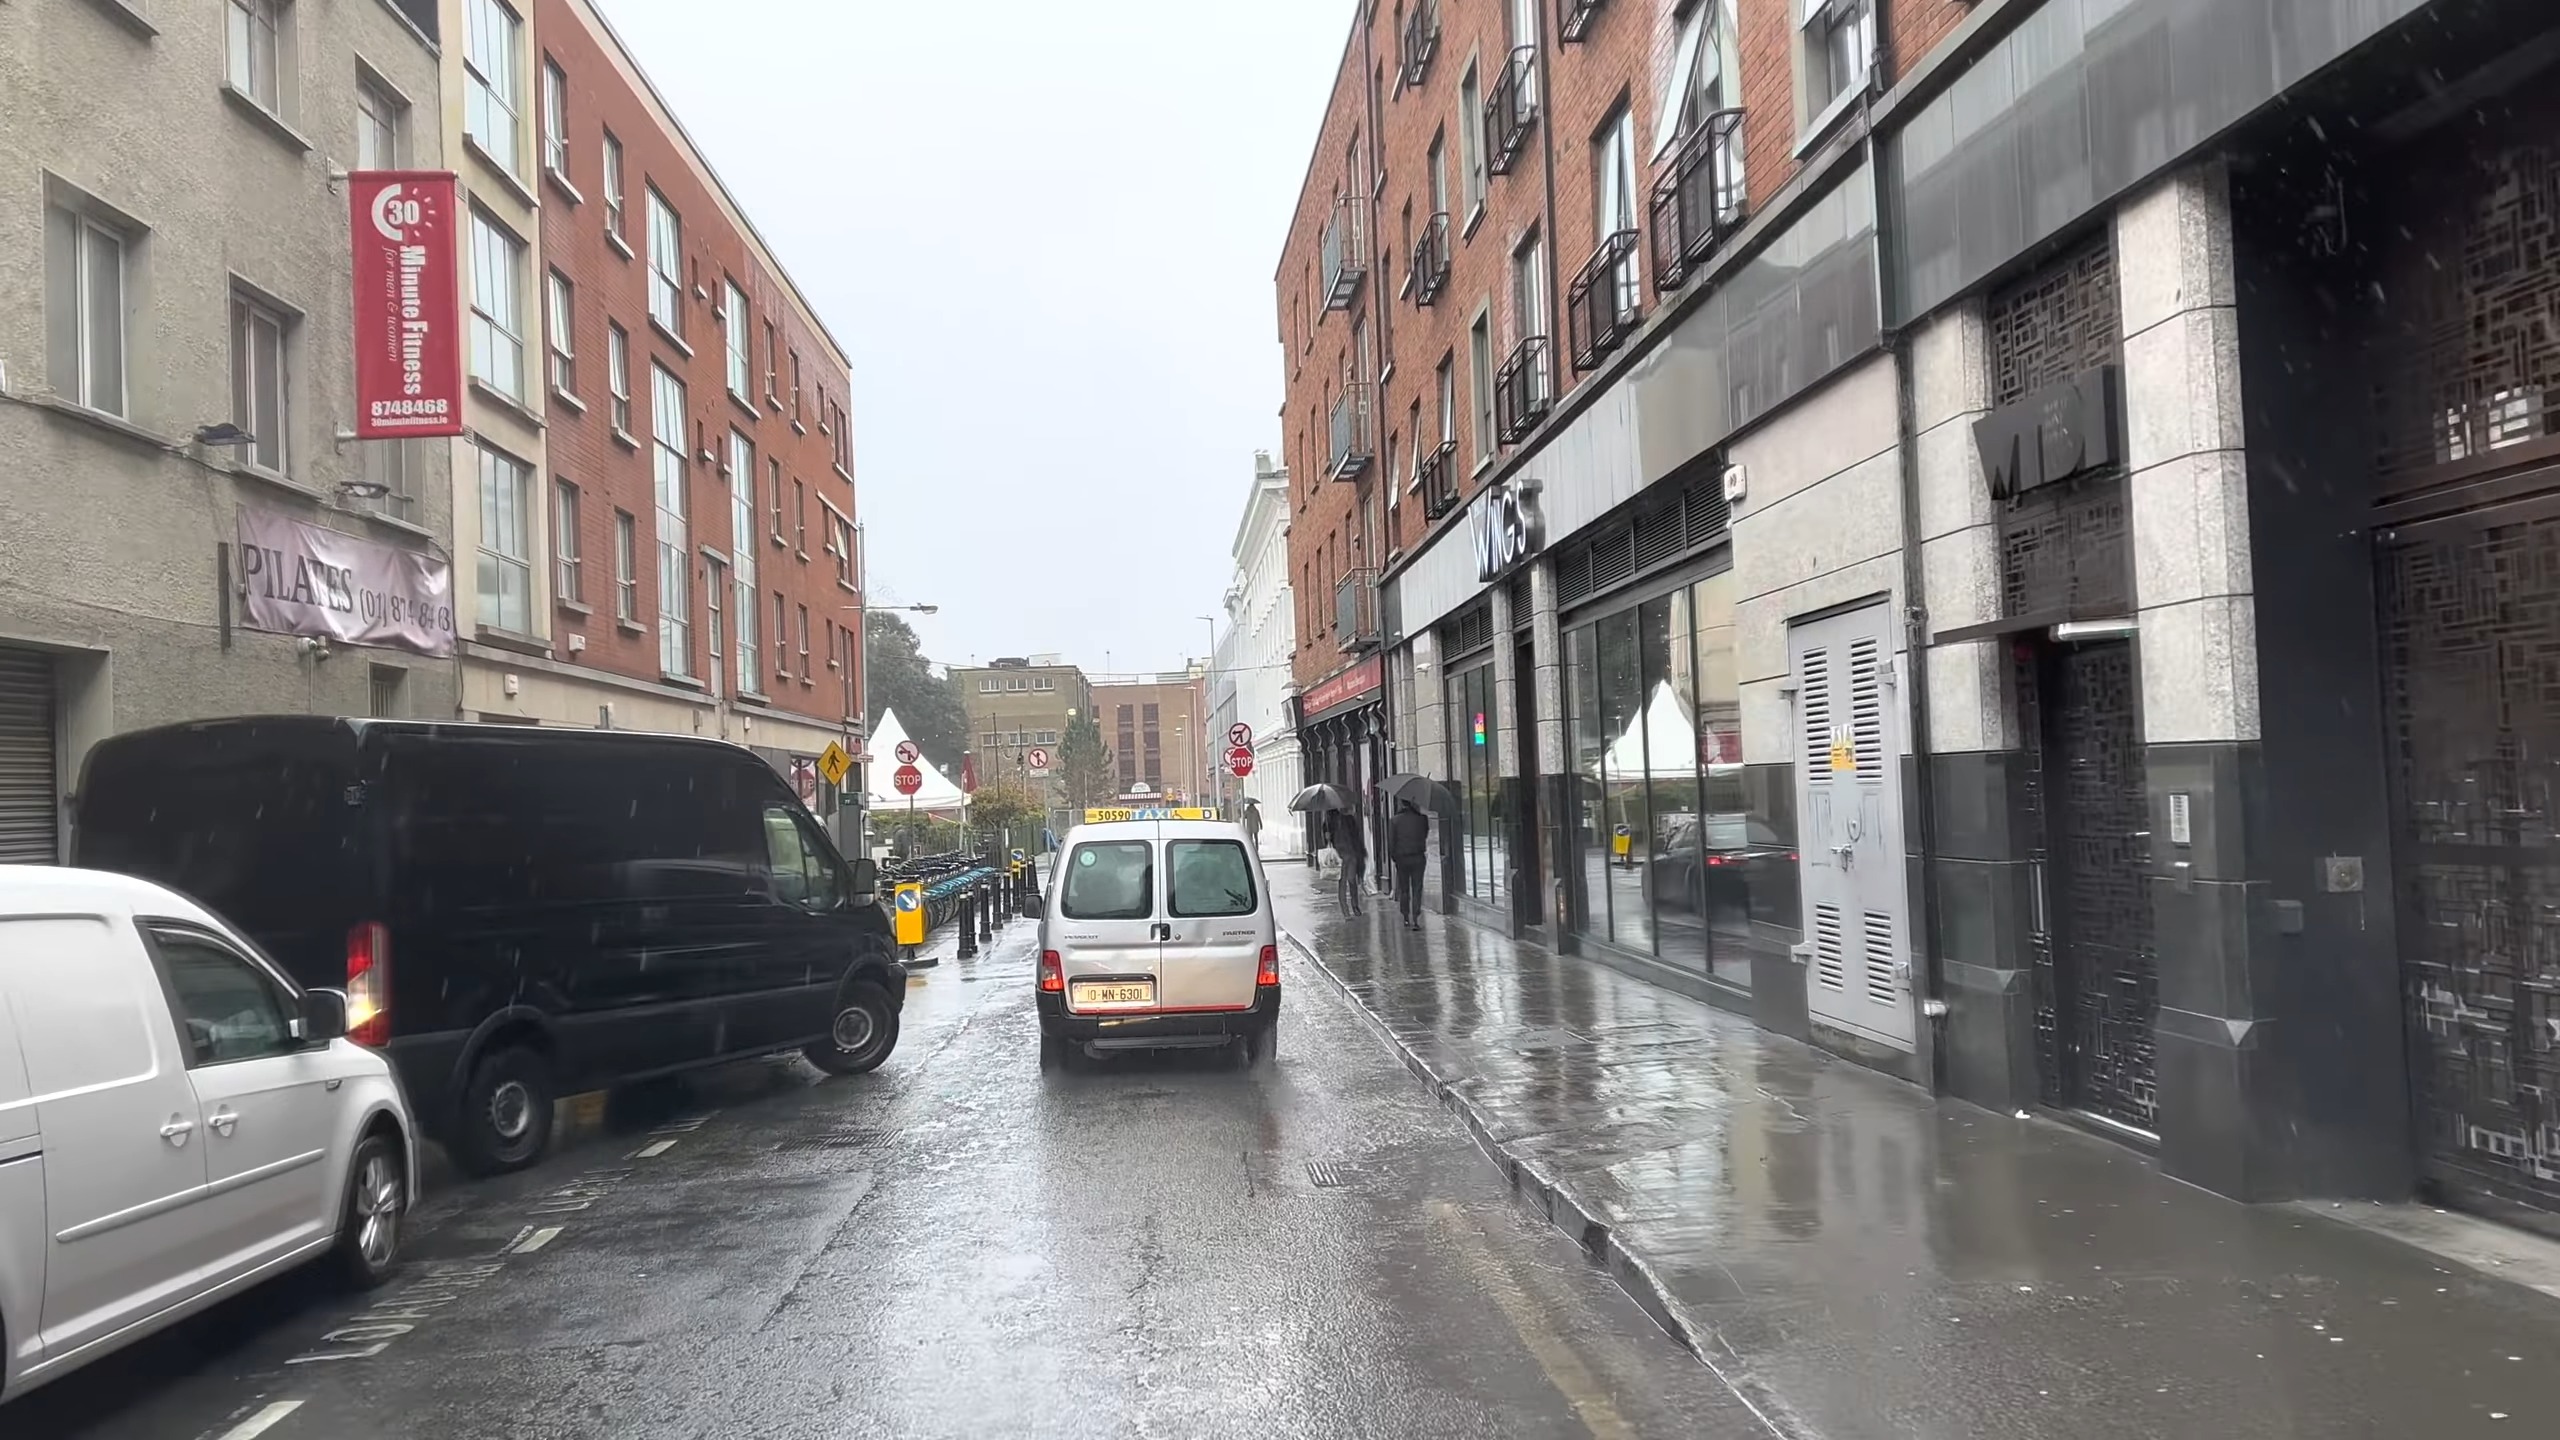
Dublin, with its historic charm and river divides, averages 28 minutes and 30 seconds. The city’s numerous bridges, each with its own story, are often traffic hotspots.
39. Bengaluru, India ?? – 29 min 10 s
Bengaluru, India’s Silicon Valley, sees an average time of 29 minutes and 10 seconds. The city’s rapid growth, both in terms of population and infrastructure, has led to increased traffic challenges.
40. London, United Kingdom ?? – 36 min 20 s
Concluding our list is London, where it takes a whopping 36 minutes and 20 seconds to cover 10 kilometers. The city’s historic layout, combined with its status as a global hub, results in its top spot on our list.
20 cities known for heavy traffic congestion that were not mentioned in the previous list:
- Mumbai, India ?? – Mumbai’s densely populated streets and rapid urbanization have resulted in some of the world’s most congested traffic conditions.
- Bangkok, Thailand ?? – Bangkok’s bustling streets and limited road infrastructure often lead to standstill traffic, especially during rush hours.
- Beijing, China ?? – The Chinese capital’s rapid growth has resulted in heavy traffic, with notorious traffic jams that can last for hours.
- Los Angeles, USA ?? – While mentioned in the previous list, it’s worth noting that Los Angeles is infamous for its traffic jams, especially on its sprawling network of highways.
- São Paulo, Brazil ?? – As one of the largest cities in the world, São Paulo’s traffic congestion is a daily challenge for its residents.
- Jakarta, Indonesia ?? – Jakarta’s chaotic traffic conditions are legendary, with gridlock being a common occurrence.
- Manila, Philippines ?? – Manila’s dense population and a high number of vehicles contribute to its consistently heavy traffic.
- Nairobi, Kenya ?? – Nairobi faces traffic congestion due to a rapidly growing population and limited road infrastructure.
- Istanbul, Turkey ?? – Istanbul’s unique position straddling two continents and its hilly terrain make traffic management a challenge.
- Santiago, Chile ?? – The capital of Chile contends with heavy traffic, especially during peak commuting hours.
- Moscow, Russia ?? – Moscow’s immense size and a high volume of vehicles on the road result in frequent traffic congestion.
- Lagos, Nigeria ?? – As one of Africa’s most populous cities, Lagos grapples with traffic congestion on a daily basis.
- Bogota, Colombia ?? – Bogota’s mountainous terrain and a growing number of vehicles make traffic management a complex task.
- Taipei, Taiwan ?? – Taipei, Taiwan’s capital, faces heavy traffic, particularly in its busy central districts.
- Houston, USA ?? – Houston, another major American city, contends with traffic congestion, especially along its extensive highway network.
- Buenos Aires, Argentina ?? – Although mentioned previously, it’s worth emphasizing Buenos Aires’ traffic jams, particularly during rush hours.
- Ho Chi Minh City, Vietnam ?? – Formerly known as Saigon, this Vietnamese city faces heavy traffic due to its rapid economic development and increasing vehicle ownership.
- Kolkata, India ?? – Kolkata’s narrow streets and historic layout can lead to traffic bottlenecks, especially in its central areas.
- Lima, Peru ?? – Lima’s traffic is characterized by a mix of modern infrastructure and older roadways, resulting in congestion in certain areas.
- Guangzhou, China ?? – Guangzhou, a major Chinese city, experiences traffic congestion as a result of its rapid industrialization and urban growth.
Frequently Asked Questions (FAQs) about Global Traffic Patterns
1. Why is London’s traffic the slowest in the world?
-
- London’s traffic congestion is a result of its historic layout, high population density, and its status as a global business and tourist hub. The city’s narrow roads, numerous vehicles, and constant influx of tourists contribute to its slow pace.
2. How do cities like San Diego manage to have such fast traffic times?
-
- Cities like San Diego benefit from well-planned infrastructure, lesser population density, and efficient traffic management systems. Additionally, the city’s geographical layout and road expansion projects have contributed to smoother traffic.
3. Are these average travel times consistent throughout the day?
-
- No, these times are averages and can vary based on peak hours, weekends, and special events. For instance, rush hours in the morning and evening can significantly increase travel times.
4. How do public transportation systems impact a city’s traffic?
-
- Efficient public transportation can significantly reduce the number of vehicles on the road, leading to decreased traffic congestion. Cities with robust public transport networks often have better traffic flow.
5. Why do some densely populated cities have better traffic flow than others?
-
- Traffic flow isn’t solely determined by population density. Factors like urban planning, public transportation efficiency, road quality, and traffic management play crucial roles in determining a city’s traffic patterns.
6. How do cultural practices, like the “paseo” tradition in Mexico City, impact traffic?
-
- Cultural practices can lead to specific traffic patterns. For instance, the “paseo” tradition in Mexico City, where residents take evening strolls or drives, can lead to increased traffic during those times.
7. Are there any initiatives to improve traffic conditions in these cities?
-
- Yes, many cities are investing in infrastructure development, public transportation expansion, and adopting smart traffic management systems to improve traffic conditions.
8. How do events and festivals impact traffic in cities like Sapporo and Milan?
-
- Events and festivals can lead to temporary road closures or increased vehicle and pedestrian traffic, leading to congestion. Cities often implement special traffic management strategies during such events.
9. Do weather conditions play a role in traffic congestion?
-
- Absolutely. Adverse weather conditions, such as heavy rain, snow, or fog, can slow down traffic considerably. Cities that frequently experience such conditions often have infrastructure in place to manage the impact.
10. How do city-specific vehicles, like “jeepneys” in Manila or “ojeks” in Jakarta, influence traffic patterns?
- City-specific vehicles can both alleviate and contribute to traffic congestion. While they offer alternative transportation means and can navigate traffic differently, they also add to the number of vehicles on the road.
In Conclusion
Traffic, while often seen as a mere inconvenience, offers a window into a city’s soul. It tells stories of its past, its growth, and its aspirations. As we’ve journeyed from San Diego’s breezy boulevards to London’s bustling bylanes, it’s evident that every city has its unique rhythm, challenges, and solutions. And while traffic might slow us down at times, it also reminds us to appreciate the journey, not just the destination.
References:
(Note: The content of the article from UC Berkeley is not fully displayed, but it appears to be related to pedestrian safety, which may be relevant to traffic studies.)
- Traffic: Why It’s Getting Worse, What Government Can Do – Brookings Institution
- This article discusses the reasons for worsening traffic congestion and the challenges policymakers face in addressing the issue. It highlights the fact that traffic congestion is a result of too many people wanting to move at the same times each day and offers potential solutions to the problem.
- How to Fix Congestion – Transportation Policy Research
- This article from the Texas A&M Transportation Institute provides various strategies to mitigate traffic congestion. It covers topics such as traffic management, travel options, system modification, additional capacity, construction improvements, freight considerations, transit services, land use planning, active traffic management, pricing strategies, bicycle & pedestrian facilities, and the role of technology in addressing congestion.