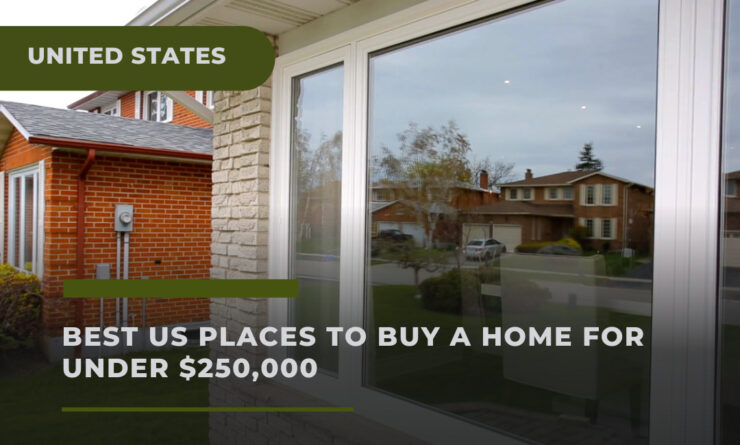
The dream of owning a family home, which serves as a long-term dwelling and a viable real estate asset, is integral to many Americans. However, with skyrocketing housing prices in several parts of the country, homeownership is increasingly becoming a luxury that only the wealthy can afford. When the median home value in your vicinity is $1 million or above, the requisite 20% down payment equates to $200,000.
In response to this, we assembled a list of optimal alternatives for those who are prepared to explore less conventional areas where housing remains affordable and the quality of life is high. The research compiled median home values from cities throughout the nation, focusing exclusively on those where prices are below $250,000. It further incorporated factors like crime rates, unemployment, and overall livability, rating each factor and merging them to rank each city.
Therefore, discover if your home city is among the places where one can anticipate buying a house at a reasonable price.
Table of Contents
ToggleTop 50 Choices
| City | Average Home Value | Livability Score | Median Household Income | Unemployment Rate | Percentage Below Poverty Line | Violent Crime Rate (per 1,000 residents) | Property Crime Rate (per 1,000 residents) |
|---|---|---|---|---|---|---|---|
| Bowling Green, KY | $237,894 | 73 | $43,633 | 3.2% | 25.0% | 3.67 | 38.31 |
| Kansas City, MO | $212,643 | 58 | $60,042 | 2.4% | 15.0% | 14.58 | 42.70 |
| Wichita, KS | $175,602 | 60 | $56,374 | 2.9% | 15.2% | 11.76 | 47.28 |
| Montgomery, AL | $128,088 | 65 | $49,989 | 2.5% | 21.2% | 6.18 | 36.23 |
| Winston-Salem, NC | $217,990 | 64 | $50,204 | 3.1% | 19.0% | 11.49 | 40.36 |
| Columbus, GA | $138,836 | 60 | $50,542 | 3.3% | 19.5% | 7.17 | 26.34 |
| Evansville, IN | $167,195 | 58 | $45,649 | 2.3% | 19.9% | 7.44 | 36.71 |
| Springfield, IL | $135,537 | 61 | $57,596 | 3.6% | 18.5% | 8.38 | 38.12 |
| Elkhart, IN | $185,429 | 65 | $43,868 | 2.5% | 19.6% | 12.85 | 31.40 |
| Lubbock, TX | $195,999 | 68 | $54,060 | 2.9% | 19.4% | 10.85 | 38.53 |
| Lafayette, LA | $202,790 | 73 | $55,329 | 3.1% | 19.5% | 6.04 | 41.26 |
| Topeka, KS | $159,014 | 61 | $50,870 | 2.7% | 15.2% | 7.11 | 45.16 |
| Corpus Christi, TX | $205,269 | 69 | $59,993 | 4.5% | 17.0% | 8.79 | 32.65 |
| Pittsburgh, PA | $211,339 | 75 | $54,036 | 3.7% | 19.7% | 5.98 | 30.02 |
| McAllen, TX | $195,966 | 81 | $52,422 | 6.8% | 21.0% | 1.82 | 18.27 |
| Greensboro, NC | $228,026 | 66 | $51,667 | 3.6% | 17.4% | 8.86 | 36.0 |
| Pasadena, TX | $206,139 | 71 | $61,182 | 3.9% | 17.9% | 6.35 | 25.24 |
| Kansas City, KS | $161,492 | 59 | $50,707 | 2.4% | 18.4% | 4.72 | 21.54 |
| Louisville, KY | $224,899 | 64 | $58,357 | 2.7% | 15.2% | 9.79 | 33.0 |
| Wichita Falls, TX | $147,753 | 75 | $50,856 | 3.3% | 18.5% | 5.82 | 31.59 |
| Grand Rapids, MI | $238,003 | 67 | $55,385 | 3.1% | 18.6% | 9.82 | 25.81 |
| Lake Charles, LA | $181,000 | 70 | $49,913 | 3.0% | 20.8% | 4.69 | 24.24 |
| Jacksonville, NC | $205,393 | 71 | $47,483 | 3.7% | 16.3% | 3.76 | 19.09 |
| Killeen, TX | $213,014 | 67 | $52,072 | 4.0% | 15.7% | 6.19 | 17.18 |
| Davenport, IA | $160,993 | 69 | $56,315 | 3.7% | 15.8% | 6.63 | 36.16 |
| Warren, MI | $184,946 | 70 | $55,153 | 3.2% | 15.3% | 5.24 | 15.61 |
| Roanoke, VA | $224,331 | 75 | $48,476 | 2.6% | 18.4% | 4.90 | 38.77 |
| Indianapolis, IN | $212,980 | 65 | $54,321 | 2.2% | 16.4% | 7.32 | 35.20 |
| Laredo, TX | $196,466 | 72 | $55,603 | 3.7% | 22.2% | 3.15 | 12.37 |
| High Point, NC | $206,176 | 62 | $54,331 | 3.6% | 14.6% | 5.22 | 27.82 |
| Odessa, TX | $198,665 | 63 | $66,769 | 3.8% | 13.4% | 5.92 | 25.98 |
| Bryan, TX | $239,999 | 73 | $49,181 | 2.8% | 23.5% | 5.79 | 19.60 |
| Columbus, OH | $235,400 | 73 | $58,575 | 3.1% | 18.4% | 5.96 | 33.16 |
| Oklahoma City, OK | $182,569 | 69 | $59,679 | 2.4% | 14.9% | 9.57 | 40.21 |
Bowling Green, Kentucky
In 2022, the average value of homes in Bowling Green, Kentucky, stood at $237,894. The livability score for the city is 73. The median household income is $43,633, with an unemployment rate of 3.2%. Approximately 25.0% of the population falls below the poverty line. The violent crime rate per 1,000 residents is 3.67, while the property crime rate is 38.31.
Kansas City, Missouri
The average home value in Kansas City, Missouri, was $212,643 in 2022. With a livability score of 58, the city has a median household income of $60,042 and an unemployment rate of 2.4%. The percentage of people below the poverty line is 15.0%. Kansas City has a violent crime rate of 14.58 per 1,000 residents and a property crime rate of 42.70.
Wichita, Kansas
Wichita, Kansas, had an average home value of $175,602 in 2022. The livability score for the city is 60. The median household income is $56,374, and the unemployment rate is 2.9%. Approximately 15.2% of the population lives below the poverty line. The city’s violent crime rate per 1,000 residents is 11.76, while the property crime rate is 47.28.
The city is very beautiful and has dog parks, so you and your canine can enjoy in your nature activities.
Montgomery, Alabama
The average value of homes in Montgomery, Alabama, was $128,088 in 2022. With a livability score of 65, the city has a median household income of $49,989 and an unemployment rate of 2.5%. About 21.2% of the population falls below the poverty line. Montgomery’s violent crime rate per 1,000 residents is 6.18, and the property crime rate is 36.23.
Winston-Salem, North Carolina
In 2022, the average home value in Winston-Salem, North Carolina, was $217,990. The city has a livability score of 64. The median household income is $50,204, and the unemployment rate stands at 3.1%. Approximately 19.0% of the population is below the poverty line. Winston-Salem has a violent crime rate of 11.49 per 1,000 residents and a property crime rate of 40.36.
Columbus, Georgia
Columbus, Georgia, had an average home value of $138,836 in 2022. With a livability score of 60, the city has a median household income of $50,542 and an unemployment rate of 3.3%. About 19.5% of the population lives below the poverty line. The city’s violent crime rate per 1,000 residents is 7.17, while the property crime rate is 26.34.
Evansville, Indiana
The average value of homes in Evansville, Indiana, was $167,195 in 2022. The livability score for the city is 58. The median household income is $45,649, and the unemployment rate is 2.3%. Approximately 19.9% of the population falls below the poverty line. Evansville has a violent crime rate of 7.44 per 1,000 residents and a property crime rate of 36.71.
Springfield, Illinois
Springfield, Illinois, had an average home value of $135,537 in 2022. With a livability score of 61, the city has a median household income of $57,596 and an unemployment rate of 3.6%. About 18.5% of the population lives below the poverty line. The city’s violent crime rate per 1,000 residents is 8.38, while the property crime rate is 38.12.
Elkhart, Indiana
In 2022, the average home value in Elkhart, Indiana, was $185,429. The city has a livability score of 65. The median household income is $43,868, and the unemployment rate stands at 2.5%. Approximately 19.6% of the population is below the poverty line. Elkhart has a violent crime rate of 12.85 per 1,000 residents and a property crime rate of 31.40.
Lubbock, Texas
Lubbock, Texas, had an average home value of $195,999 in 2022. With a livability score of 68, the city has a median household income of $54,060 and an unemployment rate of 2.9%. About 19.4% of the population lives below the poverty line. The city’s violent crime rate per 1,000 residents is 10.85, while the property crime rate is 38.53.
Lafayette, Louisiana
The average value of homes in Lafayette, Louisiana, was $202,790 in 2022. The livability score for the city is 73. The median household income is $55,329, and the unemployment rate is 3.1%. Approximately 19.5% of the population falls below the poverty line. Lafayette has a violent crime rate of 6.04 per 1,000 residents and a property crime rate of 41.26.
Topeka, Kansas
In 2022, the average home value in Topeka, Kansas, stood at $159,014. The city has a livability score of 61. The median household income is $50,870, and the unemployment rate stands at 2.7%. Approximately 15.2% of the population is below the poverty line. Topeka has a violent crime rate of 7.11 per 1,000 residents and a property crime rate of 45.16.
Corpus Christi, Texas
Corpus Christi, Texas, had an average home value of $205,269 in 2022. With a livability score of 69, the city has a median household income of $59,993 and an unemployment rate of 4.5%. About 17.0% of the population lives below the poverty line. The city’s violent crime rate per 1,000 residents is 8.79, while the property crime rate is 32.65.
Pittsburgh, Pennsylvania
The average value of homes in Pittsburgh, Pennsylvania, was $211,339 in 2022. The livability score for the city is 75. The median household income is $54,036, and the unemployment rate is 3.7%. Approximately 19.7% of the population falls below the poverty line. Pittsburgh has a violent crime rate of 5.98 per 1,000 residents and a property crime rate of 30.02.
McAllen, Texas
In 2022, the average home value in McAllen, Texas, was $195,966. The city has a livability score of 81. The median household income is $52,422, and the unemployment rate stands at 6.8%. Approximately 21.0% of the population is below the poverty line. McAllen has a violent crime rate of 1.82 per 1,000 residents and a property crime rate of 18.27.
Greensboro, North Carolina
Greensboro, North Carolina, had an average home value of $228,026 in 2022. With a livability score of 66, the city has a median household income of $51,667 and an unemployment rate of 3.6%. About 17.4% of the population lives below the poverty line. The city’s violent crime rate per 1,000 residents is 8.86, while the property crime rate is 36.0.
Pasadena, Texas
The average value of homes in Pasadena, Texas, was $206,139 in 2022. The livability score for the city is 71. The median household income is $61,182, and the unemployment rate is 3.9%. Approximately 17.9% of the population falls below the poverty line. Pasadena has a violent crime rate of 6.35 per 1,000 residents and a property crime rate of 25.24.
Kansas City, Kansas
In 2022, the average home value in Kansas City, Kansas, stood at $161,492. The city has a livability score of 59. The median household income is $50,707, and the unemployment rate stands at 2.4%. Approximately 18.4% of the population is below the poverty line. Kansas City, Kansas, has a violent crime rate of 4.72 per 1,000 residents and a property crime rate of 21.54.
The nature of this city is remarkable Kansas even has some of the most beautiful waterfalls in the US.
Louisville, Kentucky
Louisville, Kentucky, had an average home value of $224,899 in 2022. With a livability score of 64, the city has a median household income of $58,357 and an unemployment rate of 2.7%. About 15.2% of the population lives below the poverty line. The city’s violent crime rate per 1,000 residents is 9.79, while the property crime rate is 33.0.
Wichita Falls, Texas
The average value of homes in Wichita Falls, Texas, was $147,753 in 2022. The livability score for the city is 75. The median household income is $50,856, and the unemployment rate is 3.3%. Approximately 18.5% of the population falls below the poverty line. Wichita Falls has a violent crime rate of 5.82 per 1,000 residents and a property crime rate of 31.59.
Grand Rapids, Michigan
In 2022, the average home value in Grand Rapids, Michigan, was $238,003. The city has a livability score of 67. The median household income is $55,385, and the unemployment rate stands at 3.1%. Approximately 18.6% of the population is below the poverty line. Grand Rapids has a violent crime rate of 9.82 per 1,000 residents and a property crime rate of 25.81.
Michigan is known for its big crime rate as it has some of the most dangerous cities in the US.
Lake Charles, Louisiana
Lake Charles, Louisiana, had an average home value of $181,000 in 2022. With a livability score of 70, the city has a median household income of $49,913 and an unemployment rate of 3.0%. About 20.8% of the population lives below the poverty line. The city’s violent crime rate per 1,000 residents is 4.69, while the property crime rate is 24.24.
Jacksonville, North Carolina
The average value of homes in Jacksonville, North Carolina, was $205,393 in 2022. The livability score for the city is 71. The median household income is $47,483, and the unemployment rate is 3.7%. Approximately 16.3% of the population falls below the poverty line. Jacksonville has a violent crime rate of 3.76 per 1,000 residents and a property crime rate of 19.09.
Jacksonville is a very calm and quiet place for living. It’s perfect if you have kids, or pets as it has many pet parks and different activities for your child.
Killeen, Texas
In 2022, the average home value in Killeen, Texas, stood at $213,014. The city has a livability score of 67. The median household income is $52,072, and the unemployment rate stands at 4.0%. Approximately 15.7% of the population is below the poverty line. Killeen has a violent crime rate of 6.19 per 1,000 residents and a property crime rate of 17.18.
Killeen is considered to be one of the unsafest Texas cities, so if you’re thinking about moving there be careful which neighbourhood you choose.
Davenport, Iowa
Davenport, Iowa, had an average home value of $160,993 in 2022. With a livability score of 69, the city has a median household income of $56,315 and an unemployment rate of 3.7%. About 15.8% of the population lives below the poverty line. The city’s violent crime rate per 1,000 residents is 6.63, while the property crime rate is 36.16.
Warren, Michigan
The average value of homes in Warren, Michigan, was $184,946 in 2022. The livability score for the city is 70. The median household income is $55,153, and the unemployment rate is 3.2%. Approximately 15.3% of the population falls below the poverty line. Warren has a violent crime rate of 5.24 per 1,000 residents and a property crime rate of 15.61.
Roanoke, Virginia
In 2022, the average home value in Roanoke, Virginia, was $224,331. The city has a livability score of 75. The median household income is $48,476, and the unemployment rate stands at 2.6%. Approximately 18.4% of the population is below the poverty line. Roanoke has a violent crime rate of 4.90 per 1,000 residents and a property crime rate of 38.77.
Indianapolis, Indiana
Indianapolis, Indiana, had an average home value of $212,980 in 2022. With a livability score of 65, the city has a median household income of $54,321 and an unemployment rate of 2.2%. About 16.4% of the population lives below the poverty line. The city’s violent crime rate per 1,000 residents is 7.32, while the property crime rate is 35.20.
This city is not safe, so if you have a family with kids, be careful as there are a lot of rogue dogs that attack people even in their home.
Laredo, Texas
The average value of homes in Laredo, Texas, was $196,466 in 2022. The livability score for the city is 72. The median household income is $55,603, and the unemployment rate is 3.7%. Approximately 22.2% of the population falls below the poverty line. Laredo has a violent crime rate of 3.15 per 1,000 residents and a property crime rate of 12.37.
High Point, North Carolina
In 2022, the average home value in High Point, North Carolina, stood at $206,176. The city has a livability score of 62. The median household income is $54,331, and the unemployment rate stands at 3.6%. Approximately 14.6% of the population is below the poverty line. High Point has a violent crime rate of 5.22 per 1,000 residents and a property crime rate of 27.82.
Odessa, Texas
Odessa, Texas, had an average home value of $198,665 in 2022. With a livability score of 63, the city has a median household income of $66,769 and an unemployment rate of 3.8%. About 13.4% of the population lives below the poverty line. The city’s violent crime rate per 1,000 residents is 5.92, while the property crime rate is 25.98.
Bryan, Texas
The average value of homes in Bryan, Texas, was $239,999 in 2022. The livability score for the city is 73. The median household income is $49,181, and the unemployment rate is 2.8%. Approximately 23.5% of the population falls below the poverty line. Bryan has a violent crime rate of 5.79 per 1,000 residents and a property crime rate of 19.60.
Columbus, Ohio
In 2022, the average home value in Columbus, Ohio, was $235,400. The city has a livability score of 73. The median household income is $58,575, and the unemployment rate stands at 3.1%. Approximately 18.4% of the population is below the poverty line. Columbus has a violent crime rate of 5.96 per 1,000 residents and a property crime rate of 33.16.
Oklahoma City, Oklahoma
Oklahoma City, Oklahoma, had an average home value of $182,569 in 2022. With a livability score of 69, the city has a median household income of $59,679 and an unemployment rate of 2.4%. About 14.9% of the population lives below the poverty line. The city’s violent crime rate per 1,000 residents is 6.29, while the property crime rate is 37.37.
Did you know that Oklahoma lake is a home to many enormous craps? There were reported cases of fishers that caught an unbelievable sized crap in this lake.
Independence, Missouri
The average value of homes in Independence, Missouri, was $177,135 in 2022. The livability score for the city is 71. The median household income is $53,996, and the unemployment rate is 2.4%. Approximately 14.3% of the population falls below the poverty line. Independence has a violent crime rate of 5.52 per 1,000 residents and a property crime rate of 35.88.
El Paso, Texas
In 2022, the average home value in El Paso, Texas, stood at $190,159. The city has a livability score of 74. The median household income is $51,325, and the unemployment rate stands at 4.0%. Approximately 18.3% of the population is below the poverty line. El Paso has a violent crime rate of 2.54 per 1,000 residents and a property crime rate of 12.73.
Hamilton, Iowa
Hamilton, Iowa, had an average home value of $241,626 in 2022. With a livability score of 74, the city has a median household income of $50,034 and an unemployment rate of 3.1%. About 16.4% of the population lives below the poverty line. The city’s violent crime rate per 1,000 residents is 4.92, while the property crime rate is 31.95.
Pensacola, Florida
The average value of homes in Pensacola, Florida, was $234,795 in 2022. The livability score for the city is 69. The median household income is $59,119, and the unemployment rate is 2.3%. Approximately 15.3% of the population falls below the poverty line. Pensacola has a violent crime rate of 6.22 per 1,000 residents and a property crime rate of 27.74.
Longview, Texas
In 2022, the average home value in Longview, Texas, stood at $200,386. The city has a livability score of 78. The median household income is $53,854, and the unemployment rate stands at 4.0%. Approximately 18.6% of the population is below the poverty line. Longview has a violent crime rate of 3.50 per 1,000 residents and a property crime rate of 25.23.
Abilene, Texas
Abilene, Texas, had an average home value of $174,950 in 2022. With a livability score of 75, the city has a median household income of $54,493 and an unemployment rate of 3.2%. About 15.4% of the population lives below the poverty line. The city’s violent crime rate per 1,000 residents is 4.78, while the property crime rate is 20.68.
Amarillo, Texas
The average value of homes in Amarillo, Texas, was $181,193 in 2022. The livability score for the city is 73. The median household income is $55,174, and the unemployment rate is 2.6%. Approximately 15.8% of the population falls below the poverty line. Amarillo has a violent crime rate of 7.46 per 1,000 residents and a property crime rate of 33.71.
Tyler, Texas
In 2022, the average home value in Tyler, Texas, stood at $222,562. The city has a livability score of 70. The median household income is $58,385, and the unemployment rate stands at 3.3%. Approximately 14.9% of the population is below the poverty line. Tyler has a violent crime rate of 4.50 per 1,000 residents and a property crime rate of 26.44.
Norman, Oklahoma
Norman, Oklahoma, had an average home value of $227,192 in 2022. With a livability score of 76, the city has a median household income of $59,866 and an unemployment rate of 2.4%. About 16.7% of the population lives below the poverty line. The city’s violent crime rate per 1,000 residents is 3.17, while the property crime rate is 31.23.
Hampton, Virginia
The average value of homes in Hampton, Virginia, was $233,401 in 2022. The livability score for the city is 72. The median household income is $59,380, and the unemployment rate is 3.0%. Approximately 14.4% of the population falls below the poverty line. Hampton has a violent crime rate of 2.87 per 1,000 residents and a property crime rate of 24.99.
Hampton, home to the world’s largest naval base, is also one of Virginia’s most unsafe cities.
Des Moines, Iowa
In 2022, the average home value in Des Moines, Iowa, stood at $179,879. The city has a livability score of 75. The median household income is $58,444, and the unemployment rate stands at 2.8%. Approximately 15.3% of the population is below the poverty line. Des Moines has a violent crime rate of 6.32 per 1,000 residents and a property crime rate of 31.89.
Lynchburg, Virginia
Lynchburg, Virginia, had an average home value of $216,265 in 2022. With a livability score of 82, the city has a median household income of $54,015 and an unemployment rate of 2.9%. About 17.6% of the population lives below the poverty line. The city’s violent crime rate per 1,000 residents is 4.20, while the property crime rate is 20.90.
Green Bay, Wisconsin
The average value of homes in Green Bay, Wisconsin, was $206,384 in 2022. The livability score for the city is 70. The median household income is $55,221, and the unemployment rate is 2.1%. Approximately 15.4% of the population falls below the poverty line. Green Bay has a violent crime rate of 4.54 per 1,000 residents and a property crime rate of 15.22.
Joliet, Illinois
In 2022, the average home value in Joliet, Illinois, stood at $205,688. The city has a livability score of 70. The median household income is $77,373, and the unemployment rate stands at 4.2%. Approximately 10.7% of the population is below the poverty line. Joliet has a violent crime rate of 5.05 per 1,000 residents and a property crime rate of 11.51.
Fort Wayne, Indiana
Fort Wayne, Indiana, had an average home value of $195,509 in 2022. With a livability score of 75, the city has a median household income of $53,978 and an unemployment rate of 2.2%. About 15.5% of the population lives below the poverty line. The city’s violent crime rate per 1,000 residents is 2.64, while the property crime rate is 23.13.
Cedar Rapids, Iowa
The average value of homes in Cedar Rapids, Iowa, was $187,941 in 2022. The livability score for the city is 76. The median household income is $63,170, and the unemployment rate is 3.5%. Approximately 11.2% of the population falls below the poverty line. Cedar Rapids has a violent crime rate of 3.41 per 1,000 residents and a property crime rate of 26.78.
Research
To determine the 50 best places to buy a home for under $250,000, we followed a comprehensive methodology. We began by analyzing the 100 most populous cities where home values did not exceed $250,000 from January 2022 to January 2024, based on Zillow’s data from January 2024. We then considered the following factors:
- Median Household Income: We obtained this information from the United States Census Bureau’s 2021 American Community Survey.
- Livability Score: We utilized AreaVibes’ overall livability score out of 100.
- Violent Crime Rate and Property Crime Rate: We sourced these rates from Neighborhood Scout, represented as the number of crimes per 1,000 residents.
- Metropolitan Statistical Area Unemployment Rate: We used the Bureau of Labor Statistics’ preliminary data for December 2022.
- Poverty Rate: We obtained the percentage of the population living below the poverty line from the United States Census Bureau’s 2021 American Community Survey.
- Annual Cost of Living Expenditures: This estimation included groceries, healthcare, utilities, and transportation. We based it on the Bureau of Labor Statistics’ 2021 Consumer Expenditure Survey and local cost of living indices from Sperling’s Best Places.
Each factor was assigned a score, with a lower score indicating a more favorable ranking. We then combined these scores and ranked the cities accordingly. The data collection process was concluded on March 9, 2024, ensuring the most up-to-date information.
By following this methodology, we aimed to provide an accurate and comprehensive assessment of the best places to purchase affordable homes under $250,000.
FAQs
What is considered an affordable home value?
Affordable home values can vary depending on the location and local housing market. However, in the context of the information provided, affordable home values are those below $250,000.
How are the cities ranked in terms of livability?
The cities mentioned in the list are ranked based on their livability score. The livability score takes into account various factors such as quality of schools, crime rates, employment opportunities, affordability, amenities, and overall quality of life. The higher the score, the better the overall livability.
Are these cities suitable for long-term dwelling and real estate investment?
While the cities on the list offer affordable housing options, it’s important to consider various factors when evaluating their suitability for long-term dwelling and real estate investment. These factors may include job opportunities, economic stability, population growth, infrastructure development, and market trends. Conducting thorough research and consulting with real estate professionals is recommended before making any investment decisions.
How are the crime rates in these cities?
The provided information includes the violent crime rate and property crime rate per 1,000 residents for each city. These rates give an indication of the relative safety of each location. However, it’s important to note that crime rates can vary over time and can be influenced by various factors. It’s advisable to gather more recent and detailed information on crime rates from official sources or local law enforcement agencies.
What are the median household incomes in these cities?
The median household income represents the midpoint of all incomes in a particular area. The information provided includes the median household income for each city. This figure gives an idea of the income level in the community and can help assess affordability and economic conditions.
How do these cities compare in terms of poverty rates and unemployment rates?
The information provided includes the percentage of the population below the poverty line and the unemployment rate for each city. These indicators provide insights into the economic well-being of the community. Lower poverty rates and lower unemployment rates generally indicate better economic conditions and potential job opportunities.
Can I expect a good quality of life in these cities?
The livability score mentioned in the information provides an overall assessment of the quality of life in each city. However, the perception of a good quality of life can vary depending on individual preferences and needs. It’s advisable to consider factors such as access to healthcare, education, recreational opportunities, cultural amenities, and community services when evaluating the quality of life in a specific city.
Can I find affordable housing in these cities without a 20% down payment?
While the down payment requirement for a home purchase is typically 20% of the purchase price, there are alternative options available. Some programs and lenders offer lower down payment options, such as FHA loans with down payments as low as 3.5% or conventional loans with down payments as low as 5%. It’s recommended to explore different loan programs and consult with mortgage lenders to understand the available options for affordable housing.
How can I determine if a city is a good fit for me and my family?
Finding the right city depends on various factors, including personal preferences, career opportunities, proximity to family and friends, lifestyle choices, and access to desired amenities and services. It can be helpful to visit the cities of interest, research local resources and community profiles, and consider factors such as climate, education options, healthcare facilities, recreational activities, and cultural offerings to determine if a city aligns with your specific needs and priorities.
Are there any additional resources for exploring affordable housing options?
Yes, several resources can help you explore affordable housing options further. Consider visiting real estate websites, consulting with local real estate agents, contacting housing authorities or nonprofit organizations that specialize in affordable housing, and utilizing government programs or incentives designed to promote affordable homeownership.
Final Words
The information provided includes a list of 50 cities where one can anticipate buying a house at a reasonable price, with home values below $250,000. The cities are ranked based on their livability score, which takes into account factors such as crime rates, unemployment, and overall quality of life. Each city also includes data on median household income, poverty rates, violent crime rates, and property crime rates.
It’s important to note that the suitability of these cities for long-term dwelling and real estate investment may vary based on individual preferences and goals. Factors such as job opportunities, economic stability, and market trends should be considered when making such decisions. Additionally, crime rates can change over time, so it’s advisable to gather the most recent and detailed information on crime from official sources or local law enforcement agencies.

